Petflation 2017: The Industry sets a record!
We’re just coming off another exciting and record setting Global Pet Expo so it seems like the right time to slow things down a bit. Usually the perfect subject to do that is the Consumer Price Index. The annual small fluctuations can have an impact on spending but they don’t generate headline news…usually. However, we are in the Pet Industry so we have learned to expect the unexpected and in terms of Petlation, the 2017 results were definitely unexpected.
The inflation rate for Total Pet in 2017 was only 0.4%. This is the lowest rate recorded since they began keeping records back in 1997. It even beat out the 0.6% rate in 2010 which was driven by the Great Recession. Every segment contributed and deserves a headline:
- Pet Food Prices fell -1.1%, the biggest drop ever and the 4th annual decrease in the last 8 years.
- Veterinary Prices went up 2.1%. This was the smallest increase in history.
- Pet Services Prices increased 1.1%. This is half of the 2016 rate and only 2010 (0.9%) had a smaller increase.
- Pet Supplies prices fell -0.4% to register the 5th annual decrease in 8 years. They’re now -5.3% below the 2009 peak.
Let’s put these changes in perspective. As we look back over the years since 1997, there seems to be 3 distinct periods in which the inflation rate for each segment had a similar trend. The periods are of varying lengths and some segments took the trend to a far greater extreme. We’ll look first at the overall inflation from 1997 to 2017 then these periods:
- 1997 to 2007
- 2007 to 2009
- 2009 to 2017
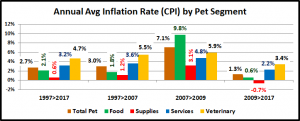
Overall 1997 to 2017 – As usual, the service segments and the product segments seem to almost be in a different industry. This produces a Total Pet that seems perhaps a little high, but not unreasonable. Supplies and Veterinary are at the extreme ends of the spectrum. Pet Food looks like the most rational of the group. Let’s do a direct comparison with some categories outside of the pet industry over the same period to put these numbers in perspective:
- Pet Food: 2.1%; Human Food: 2.3% – The inflation rate of Pet Food is right on target!
- Veterinary: 4.7%; Human Medical Care: 3.6% – 30% greater than Human Medical. That’s amazing and too high!
- Total Pet: 2.7%; Overall U.S. CPI: 2.1% – It’s in the “ballpark” even after being driven up by the service segments.
1997 to 2007 – Pet Owners became Pet Parents during this time and towards the end of the period took this a step further to more humanize their Pets. The CPI for the product segments had a reasonable rate of increase which worked for Consumers, Retailers and Manufacturers. The inflation in the service segments was abnormally high, especially in Veterinary. However, Pet Services has always been more dependent on higher income so these households were less impacted by the rising prices. Veterinary Services were viewed as a need so Pet Parents continued to spend their money.
2007 to 2009 – This is a 2 year period in time where a combination of circumstances created the highest Petflation rate in history. First and foremost was the Melamine recall in the Pet Food Segment. Consumers feared for the safety of their pets and demanded that Pet Food be made in the USA to insure safety. They later upped this demand to all ingredients must be made in the USA. This resulted in a radical increase in production cost and retail price – over 20% in just 2 years. However, Pet Parents just spent the money. It was a matter of the safety of their Pet Children.
This was also a very flush time in the U.S. economy as well as in the Pet Industry. We can do no wrong was the attitude. The price increase rate for services increased by 33% to 4.8%. Even the already astronomical Veterinary price increase rate moved up to almost 6%. However, the Supplies segment saw the average annual CPI increase almost triple, from 1.2% to 3.1%. There is no true explanation for this one, except, perhaps. Raise the price. They will pay it. Then came the great recession and the aftermath/recovery.
2009 to 2017 – Total U.S. Consumer spending fell in 2009. The last time that this had happened was in 1956. Prices in the overall market also dropped in 2009 as Retailers scrambled to recover lost $. The impact in both Pet Spending and pet pricing didn’t occur until 2010 but it has been ongoing. The Product section has seen the most turmoil in pricing. Food prices have deflated in 4 of the past 8 years giving Pet Food an annual CPI rate of 0.6%, about 1/3 the rate of the “normal” years from 1997 to 2007. Pet Supplies pricing is actually down 5.3% since 2009 as 5 of 8 years have had deflating prices. For the record, Pet Supplies prices officially peaked in September of 2009. Even the Service segments are feeling the effect. The CPI increase of both service segments is down significantly from past years. Let’s take a look at our outside comparison for this period.
- Pet Food: 0.6%; Human Food: 1.7% – Obviously, the Pet Food market has become incredibly competitive.
- Veterinary: 3.4%; Human Medical Care: 3.0% – Vet Prices still increasing 13.3% faster than Human Medical.
- Total Pet: 1.3%; Overall U.S. CPI: 1.7% – A Big switch. The Petflation rate is now lower than the overall U.S. CPI.
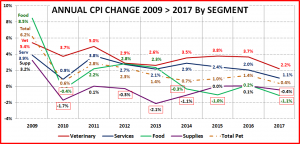
The period from 2009 to 2017 has been a time of change and in some cases, a time of turmoil regarding pricing in the Pet Industry. The next chart shows the annual change in CPI for all segments and Total Pet. It should help put this pricing “evolution” into better perspective.
- The first thing of note is that the recession had a big impact. In 2010 the inflation rate slowed markedly, especially in the Non-Vet Services. However, the prices in the product segments actually deflated, especially Supplies.
- Apparently 2010 was looked upon as an anomaly as all but the Supplies Segment tried to increase prices at a more usual rate in 2011. In general this was not successful. Let’s look at the path of each segment.
- Veterinary – After bumping prices by 5% in 2011, they immediately dialed back their rate of increase to under 3% for the next 2 years. Prior to this they had never had 2 years in a row even under 4%. They bumped the increase to 3.5% in 2014 and it remained above 3.5% but under 4% through 2016. Even this was apparently too high. They experienced fluctuating revenue and dropping frequency in visits from the post-recession price sensitive consumers. In 2017, the inflation rate dropped to a record low 2.2% as pricing pressure intensifies in this segment,
- Services – The pattern starts out like Veterinary with a dip in 2010 and a “back to normal”, 3.8% increase in 2011. However, this didn’t work as the annual increases fell to 2+% and stayed there for 5 years. Services spending is more driven by higher income households than any other segment so they are less impacted by moderate price increases. They appeared to have found a sweet spot as sales continued to outpace inflation. Then in 2017 the inflation rate fell to 1.1%, the 2nd lowest ever. It may be that this segment is starting to feel the impact of increased competition.
- Pet Food – In 2009 Pet Food was still feeling the pricing impact due to the switch to “all made in the USA”. Food prices actually deflated in 2010. However, they returned to a more normal pattern of a 2+% increase for the next 3 years. Then we began a wave of increasingly more premium food trends. Although consumer spending increased, the overall prices decreased as “regular” brands tried to “buy back” lost consumers. There is also is another factor. Once a trend takes off, this increases the competitive pressure between those brands, retailers and even between retail channels. This has continued through 2017 and even intensified as the internet is increasingly becoming a player in the Pet Food game. Pet Food prices have deflated in 3 of the last 4 years.
- Pet Supplies – No segment has been impacted more by the recession than Supplies. They are largely discretionary spending and many categories have become commoditized. That makes them extremely price sensitive. If prices go up, spending almost always drops. This usually comes from decreased purchase frequency. A seemingly small drop can make a big difference. If average purchase frequency is 60 days and it falls to every 66 days, that 10% drop can mean $1.5B less spending. The Food segment has got around this competitive pressure by introducing innovative, ever more premium foods. The Supplies segment has not seen many premium, “must have” innovations.
- Total Pet – In 2017 the Total Pet inflation rate set an all-time record low of 0.4%. This average is determined by the individual segments. All segments were lower than 2016. However, this Total Pet number can be deceptive. High inflation in the Service segments plus deflation in Products can produce a nice industry average but it comes from 2 negative situations. For healthy, long term growth we need the products segments to go positive and the service segments to have moderate inflation. If we could get these annual rates:
- Supplies: 0.5% · Food: 1% · Services: 1.5% · Veterinary: 2.5%
- Every segment would be better off and the Total Pet rate would be 1.5% which is still lower than the overall U.S. CPI.
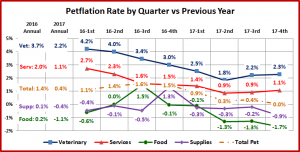
We have tracked the annual changes in inflation from 2009 to 2017. In 2016-17 the CPI dropped sharply. To determine when this trend started, we noted the CPI changes by quarter vs the previous year. Suggestion: Follow 1 color at a time.
The annual Petflation rate for every industry segment dropped in 2017 versus 2016. The Service Segments’ CPI rate was reduced by almost 50%. However, The Product segments turned a minimal CPI increase in 2016 to Price deflation in 2017 as both went negative.
There are some similarities in the pattern for the two Service Segments as they both reached the low point in the second quarter of 2017 and then turned up slightly. By the final quarter in 2017, their inflation rate had been cut in half from the first quarter of 2016.
The Product segments also had some similarities. They both had a major quarterly pricing lift, although the Supplies segment was delayed by three months. Both spent almost every quarter below the pricing of the previous year and the biggest dip occurred in the final quarter of 2017. Let’s review each segment.
- Veterinary – CPI 2016: 3.7%; CPI 2017: 2.2% – Down 1.5%. The inflation rate was stable in the first 2 quarters of 2016 at about 4%. It then steadily fell for the next 12 months, bottoming out at 1.8% in the second quarter of 2017. It then moved up slightly but remained basically stable at the 2.2% annual rate. Since high prices have resulted in a reduced frequency in Vet Clinic visits. This significant price slowing could increase spending.
- Services – CPI 2016: 2.0%; CPI 2017: 1.1% – Down 0.9%. The inflation rate in Services has generally been in the 2.5% range. Since spending in this segment is more driven by higher income households than any other segment, the steady growth has basically been unaffected. This substantial drop in the CPI rate probably reflects the increased competition in the segment. This includes more separate service companies as well as an increasing number of pet stores and Vet clinics offering services.
- Pet Food – CPI 2016: 0.2%; CPI 2017: -1.1% – Down -1.3%. Pet Food had a sudden spike in prices in the 3rd quarter of 2016 then began deflating, especially after the first quarter in 2017. The Food segment is basically operating with new rules. In the “old” days, deflation would result in reduced spending as consumers didn’t buy more food because prices were cheaper, they just spent less. Today the Pet Food segment is being driven by a succession of trends to ever more expensive premium foods. The deflation and the up and down CPI reflects the incredible competition in the segment as manufacturers and retailers, including the internet, vie for the Consumers Pet Food $.
- Pet Supplies – CPI 2016: 0.1%; CPI 2017: -0.4% – Down -0.5%. Pet Supplies pricing was down in 7 of the 8 quarters. The big anomaly was the huge spike in prices in the 4th quarter of 2016. Coming in the peak buying season, this was unusual, to say the least. This spike had a major impact on the CPI of both 2016 and 2017. It turned 2016 positive and mitigated the across the board pricing drops in 2017. The great recession had a big impact on the Supplies segment. Although many products are “needed”, much of the spending in this category is discretionary. Also, more and more categories have become commoditized. This makes them very price sensitive. When prices edge up, spending usually falls. If prices fall, spending edges up. When consumers spend more upgrading their Pet Food, they cut back on Supplies. Most of the spending fluctuation comes from a reduction or increase in the frequency of purchases. All of these factors have created a spending roller coaster for Supplies.
- Total Pet – CPI 2016: 1.4%; CPI 2017: 0.4% – Down 1.0%. The Total is definitely a sum of the parts. The CPI rate in 2016 was very steady at or near 1.4% all year. However, when the CPI rate in the Service Segments began to drop the Total Pet CPI was buoyed up by big lifts in the Food and Supplies segment. In 2017, Service Segments slowed their decline and flattened out. However, the Products segments deflated in every quarter. The CPI for every segment was lower in 2017 than in 2016 and resulted in a record low for Total Pet.
So why track the CPI change? Because changes in prices can and do impact Consumer Spending behavior. In our analysis of the demographics of Pet Spending, household income was the single biggest factor affecting the results. Money Matters Most. This price sensitivity has grown since the Great Recession. High inflation in Veterinary Services has resulted in spending cut backs by the more price sensitive groups. The Services segment has so far been unaffected but perhaps that time has come. The Food segment has gotten around this issue through a succession of upgrades in quality and price. The Supplies segment is incredibly price sensitive and desperately needs some “must have” innovations. Hopefully we will come to a middle ground in Petflation that works both for consumers and industry participants.



Nice work as always, John! Thanks for sharing. Price stability is driven by economic conditions but also by “cost fatigue.” Consumers are hitting a ceiling and won’t just keep spending more and more. $80-120 a bag dog food will see slow growth, while well-defined nutritional quality at a fair price will surge ahead in the next cycle. The equation is Q+V=S>CL (QUALITY+ VALUE = SATISFACTION, leading to greater CUSTOMER LOYALTY.