Pet Stores in the U.S. – A 25 year $ales history – 1987 to 2012
Pet Food and Supplies are sold seemingly everywhere today – 150,000 outlets of all kinds – clothing stores, supermarkets, even gas stations. However, when you look at the beginning of this colossal industry, you must think of the independent pet store as the foundation on which the massive “Pet Skyscraper” was built. We will take a look back to 1987 to see where this channel was and how it has evolved through the years.
The data in this report is courtesy of the U.S. Census Bureau – their Economic Census. The early years have only basic information but since 2002, more detailed information is readily available.
Let’s take a look at some data:
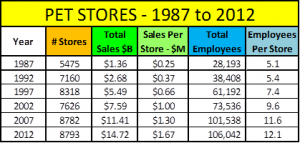
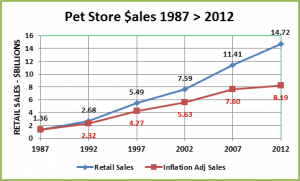
This little chart has a wealth of information but let’s make it a little easier. First with Total $ales:
- Total Growth: ↑ $13.36B (+982.3%); Average annual growth rate = +10.0%
- Real Growth: ↑ $6.83B (+502,2%): Average annual growth rate = +7.4%
Pet Food and Supply prices went up 79.8% from 1987 to 2012. This is an annual inflation rate of 2.4% which is lower than the overall U.S. inflation rate of 2.9%. However, this doesn’t tell the whole story. From 2007 to 2009 Pet Food and Supply prices increased an incredible 17.0%. (8.2% per year). Coming at the onset of the recession, this drove consumers to look for value. The result was that many consumers moved to other channels, resulting in a 15% drop in market share. Food and Supply prices have fallen or at least flattened out since 2009, but the rate of “real” sales growth in Pet Stores has slowed significantly.
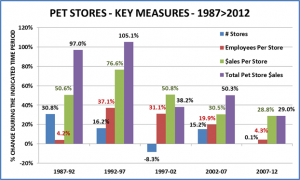
No matter how you look at it, the overall sales growth since 1987 has been amazing! Let’s look at some key contributing factors to the retail $ales growth in Pet Stores.
- 1987 to 1992 – The Number of Pet Stores grows significantly – from 5475 to 7150 (30.8%). The number of employees per store is about the same. Superstores were just getting started so these were mostly traditional stores. The amount of sales per store increases 50% as American’s love for pets truly begins to show. The result – sales basically double in 5 years – to $2.7B.
- 1992 to 1997 – The initial rise of Superstores. Note the 37.1% increase in employees per store. They are being built and they generate significantly more volume per store – 76.6%. The result – sales more than double in 5 years and now total $5.5B.
- 1997 to 2002 – Superstores continue to rise but at a cost to the independents. The net result is 692 fewer outlets (-8.3%). The Sales per store increases 50.8% which reflects the higher percentage of superstores. The total channel sales growth slows markedly from the spectacular rate of the previous the 10 years. The result – sales reach $7.6B – an increase of 38.2%.
- 2002 to 2007 – The channel adds 1156 stores – a 15.2% increase – and reaches a record high number. Most of the new outlets are superstores. The per store sales volume goes up 30.5%, reflecting this change. The result – sales grow 50.3% to $11.4B.
- 2007 to 2012 – Huge price increases…plus a major recession in this time period. There is no growth in the number of stores, but an even higher percentage are superstores. Sales reach $14.7B. The increase is 29.9%. This is the smallest in 25 years and exactly mirrors the per store sales volume growth. Also consider:
- The overall pet food and supplies category (in all channels) grew 50% from 2007 to 2012
- Actual Pet Store Sales from 2007-2012 was only up 7.7% – (Factoring in the huge price increases)
- The result – Pet Store Sales grew but the channel had a rather a big loss (-15%) in market share.
Now that we have a good overall picture of the growth in the Pet Stores Segment, let’s open the door and go inside. We’ll look at the sales of some major product categories – number of stores, $ales, share of the stores’ total revenue. We’ll see if there is any “internal migration”. Detailed information is available since 1997 so that will be our major focus.
PET STORES: NAICS CATEGORY 45391
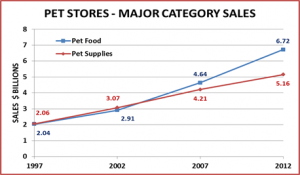
Let’s review each of these 6 product categories to see how they have fared from 1997 to 2012. To enhance the visual aspects of the analysis, we will divide them into 2 segments based upon sales volume – major and minor. Pet Foods and Supplies have always generated at least 80% of the receipts in Pet Stores. Here’s what their sales look like since 1997.
Pet Food became the largest category in 2007 and increased its lead in 2012.
- Sales in 2012 were $6.72B; ↑$4.66B (226.2%) since 1997.
During the same timeframe, overall Pet Store sales were up 167.3% so Pet Food Sales was a major factor in the channel’s growth. The introduction of numerous premium foods probably helped this category take over and hold the number 1 position. Sales of the premium foods were also less likely to be poached by other retail channels.
Pet Supplies was the biggest dollar producing category until Food took over in 2007.
- Sales in 2012 were $5.16B; ↑$3.1B (150.5%) since 1997.
The rate of growth for Pet Supplies is slightly below the overall channel rate, which is being pushed up by food sales. Growth is slowing in this product category because of the increased retail distribution in competitive channels – especially since the recession. Pet Supplies pricing has actually fallen since 2009, which indicates just how strong the competition is.
Next we’ll look at the “minor” volume product categories including Pets; Fish & Aquarium Products; Pet Care Services; All other NonPet Products. Book sales are bundled in with NonPet sales. Changing technology has depressed all Book Sales. Pet Book revenue in 2012 has actually fallen below 1992’s sales. In this section, changes in the number of outlets offering a product category may become significant.
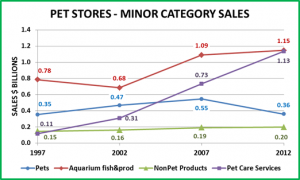
Pet Sales – This “product” category is what the Pet Industry is all about. Although it should be noted that Dogs and Cats are by far the most popular companion animals and most are not acquired in Pet Stores.
- Sales in 2012 were $0.36B; Essentially equal to 1997.
If you consider the increase in prices since 1997 (39.8%), the amount of pets being sold is actually down 27.0%. The number of outlets selling live pets has fluctuated up and down but is only down 5% from 1997. The only conclusion is that acquiring pets in pet stores is losing its popularity.
Fish & Aquarium Products – This too was a signature category. Aquariums have always been a mainstay of pet stores.
- Sales in 2012 were $1.15B; ↑$0.37B (47.4%) since 1997.
Sales dropped sharply in 2002 primarily due to the radical drop in store count. This was a strong growth period for super stores and a lot of independents carrying fish went out of business. Store count and sales bounced back in 2007 but have virtually zero growth since then. Flat sales in a growing market indicate this category has turned downward.
NonPet Products – This category can encompass a lot of ground – clothes, gift cards, hardware…almost always with a pet theme or in some way relating to Pets.
- Sales in 2012 were $0.2B; ↑$0.05B (33.3%) since 1997.
This is a very minor segment. Considering price increases, it has actually declined since 1997.
Pet Care Services – This puts a retail “face” on services, a fast growing segment of the total Pet Industry.
- Sales in 2012 were $1.13B; ↑$1.02B (927%) since 1997.
Making pet care services available in Pet Stores makes “total sense” and obviously the consumers have responded. This category contributed 10.8% of Pet Stores’ total increase in sales from 1997 to 2012. Services in Pet Stores grew 54.7% between 2007 and 2012. This was greater than every other category including food and actually greater than the overall Pet Products growth in the entire retail market. Pet Stores lost 5.9 points of market share between 2007 and 2012. Without the strong appeal of in store pet services, the loss may have been greater.
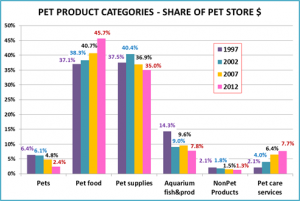
Now let’s try to get a visual of all the movement. The best way to compare these different categories is by looking at their relative share of the total. The following graph shows the market share attained by year for each of the Pet Product categories that we have reviewed. Let’s take a look. Then recap our Pet Store observations.
Here’s where the categories are in 2012 and their change in market share since 1997:
- Pet Food – 45.7% ↑8.6 pts
- Pet Supplies – 35.0% ↓2.5 pts
- Aquarium Fish/Products – 7.8% ↓6.5 pts
- Pet Services – 7.7% ↑5.6 pts
- Pets – 2.4% ↓4.0 pts
- NonPet Products – 1.3% ↓0.8 pts
Summary – 1987 to 2012
The Pet Store Channel has grown spectacularly since 1987, becoming the #1 channel for Pet Products in 1997 and holding that position for over 10 years. Then the recession pushed many consumers to more value conscious channels. Some of the major events in this journey were:
- Creation and proliferation of Super Stores (provided the broad product selection the consumer demanded)
- Development of Premium Pet Foods (often limited distribution, helped Pet Stores gain & retain market share)
- Growth of “in store” Pet Care Services (another “plus” in sales which helps attract consumers to pet stores)
- Stagnated sales in the Aquarium Fish hobby (still a large category, but the growth seems to have stopped)
- Decline in the purchases of live pets (Not the largest source of Dogs and Cats, but birds, reptiles and small animals)
- Growth of the internet (provides an even better selection of pet items than stores…and at a better price)
- Major Recession in 2008 – 2009. (which brought to the forefront the retail pricing in the channel)
- Radically Increased Competition as Pet Products are available in Outlets doing 47% of total U.S. retail.
Pet Stores, with 33.8% of the market currently hold the #2 position behind the total of All General Merchandise Stores. However, they are still the single biggest individual retail channel segment, with a substantial lead over SuperCenter/Clubs at 24.1%.
What does the future look like for Pet Stores? They are not significantly adding outlets and they are being attacked on all sides by SuperCenters/Clubs, The Internet, Supermarkets and even $ Value stores, who provide varying benefits of value, convenience and in the case of the internet, even wider selection.
The key for Pet Stores is the “personal” nature of pets. People are called “pet parents” for a reason. Pet Stores can and should provide the most personal experience for their customers. How many other outlets allow you to bring your pet into the store…actually try on a harness…sample a treat? Where else can you find a knowledgeable person to talk to about any issues that you’re having? However, they must also respond to the competition…a website, with online ordering (and in store pickup option); take a hard look at margins; run strong, well timed promotions – bundled and/or cross segment; use displays; develop or maximize a loyalty program with consumer specific deals and other technological advances; conduct regular category management reviews to identify trends and maximize productivity; actively search for and add new products that give a “real” enhancement to the lives of Pets and their “parents”. It’s a battle for the consumer’s hearts and minds…and their Pet $. You must constantly fight hard to get and keep your share.


