Pet Prices Update: September 2015 – Things are looking UP↑
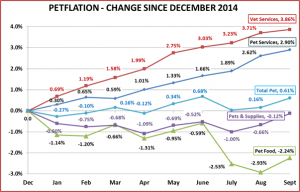
All segments – even Food, saw price increases in September. Overall we are rebounding after the huge July drop in Food & Supplies prices took the whole industry negative. October and November should be calm with moderate increases leading up to December. That is the big question remaining. Except for 2014, prices for Food and Supplies have fallen in December since the recession. We’ll see.
Why does all this pricing info matter? Pricing is intimately linked with Consumer Expenditures. In our recent Post on 2014 Pet Expenditures we saw how steadily rising prices on Food and Supplies in the second half of the year helped change 2014 from a good year to a great year for supplies…and turned a negative into a positive for Food. By the same token, rapidly rising Veterinary prices contributed to lower income households spending $1B less on Veterinary Services. However, it’s not just low prices. It’s value. You can charge more if it’s “worth it”…and you can prove it to the consumer, who now can compare products and prices instantly.
First, let’s take a look at what 2015 looks like so far…
SPECIFICS ON CPI CHANGES
Veterinary Services
- Sept – Up ↑ 0.15% (Last year Sept went Up ↑ 0.19% – about the same)
- Year To Date: Up ↑3.71%
NonVet Services
- Sept – Up ↑ 0.28% (Last year Sept was Flat 0.00% – big difference)
- Year To Date: Up ↑2.90%
Pet Food
- Sept- Up ↑0.70%% (Last year Sept went Up ↑0.40% – welcome increase)
- Year To Date: Down ↓-2.24%…Huge!
Pets & Pet Supplies
- Sept- Up ↑0.55% (Last year Sept went Up ↑1.38%…Less Volatile)
- Year To Date:↓-0.12%…coming back!
Total Pet
- Sept- Up ↑ 0.44% (Last year Sept went Up ↑0.60% – All segments are up – more moderation)
- Year To Date: Up ↑0.61% – On track for a moderate increase.
OBSERVATIONS
- Food prices are still “in the cellar”. Let’s hope the September increase continues through December to moderate the impact of the deflation on annual revenues.
- Supply prices are moving in the right direction and with an annual increase almost certain.
- Veterinary and Non-Veterinary services are showing greater than normal increases for this time of the year. This is the opposite problem to food but can and will affect spending by price sensitive consumers.
- The Total Pet Market Prices will definitely stay positive for the year. The YTD increase of 0.61% looks pretty nice until you look beneath the surface and see that it is produced by strong inflation in the Services and the steep deflation in the Food Segment. The annual projection will be in an acceptable range. We just need moderation in the segments.
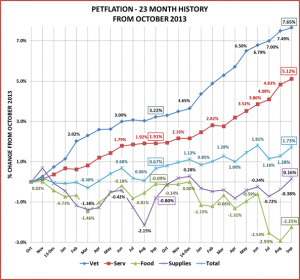
Next, let’s look at the monthly history over the last 23 months to put this month’s data into perspective. September of 2015 and 2014 are outlined so you can see the journey over the last 12 months.
COMMENTS
September is often a down month for Supplies but moderate for other segments. This year all segments turned up. This chart makes it easy to visualize our concerns. The Service Segments are basically going steeply up while the Supplies and Food Segment are on a roller coaster. Unfortunately, for Food the rollercoaster is “under water”. Total Pet is up about 1.1% versus a year ago.
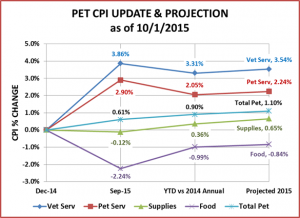
The chart below consolidates key data and compares the 2015 YTD CPI to the 2014 annual CPI. It also includes an updated projection of the annual CPI change for 2015. December could produce a drop in Food and/or Supplies but October & November are generally up…across the board.
COMMENTS – BY INDUSTRY SEGMENT
Pet Food – The price deflation in this largest segment is the biggest concern in the industry. Prices dropped -2.35% from June to August, the largest 2 month drop in history. They finally turned up in September and should continue upward through November. If we are lucky they will continue upward through December, like 2014. There is not enough time for a full recovery but this would help to mitigate the impact of what is certain to be the second consecutive deflationary year for this segment. Prices are now down -2.24% since December, but last month they were down 2.93%. Right now Pet Food prices are still basically equal to 2012 – three years ago. Remember, with a segment like Food, deflation doesn’t cause consumers to buy more. They buy the same amount…just spend less. We are projecting an annual decrease in the CPI of o.84%
Pets and Pet Supplies – In the chart prices are down 0.12% since December. However, December was the pricing peak for 2014 which was a first since the recession. When you look at the annual numbers, we are 0.36% ahead of last year’s overall pricing with at least two more months of highly probable increases. We may still see a price drop in December but we’re looking at a projected CPI increase of 0.65%
Since 2009, Supply prices have fallen 5.0%. Prices were flat in 2011(up 0.05%) but every other year showed a decline, with the biggest drop (down -2.1%) coming in 2013. It takes time and consistency to stop deflation. Let’s hope 2015 is the marks the beginning of the turnaround.
NonVet Services – Inflation in this segment is becoming an increasing concern. Instead of prices flattening out in the summer and early fall, the increases are accelerating. We now expect prices to increase 2.24% in 2015 but they could go higher. They are actually 2.9% above September 2014. This could slow the segment’s overall growth and limit the appeal to value driven consumers.
Veterinary Services – Prices in the Veterinary Services Segment are projected to be Up 3.54% in 2015. It looks like the segment will beat last year’s price increase of 3.5%. We saw in our recent post on 2014 Pet Expenditures that the segment continues to grow strongly but the increases are generally coming from the high income Pet Parents – $120K and above. Low income households spent $1B less.
Total Pet Market – We could be seeing the “beginning of the end” of the deflation that has plagued the Supplies segment since 2010. It’s a welcome change to have good pricing news for Supplies. The huge Food segment is the biggest ongoing concern. A second consecutive year of deflation is a certainty. Historically, food prices have only dropped in one other year – 2010 (-0.4%). We should note that this decrease came after an 8.6% increase in 2009, in the heart of the recession. It’s remarkable that the drop wasn’t greater. Deflation appears to be good for the consumer. It’s cheaper…I can buy more. That doesn’t work for products like food and it puts tremendous pressure on manufacturers and retailers. This can ultimately result in reduced choices for consumers…which is not good…and there is no easy fix. Make no mistake. You can charge more for your product. There is only 1 requirement. As we have often said, today’s consumers are searching for Value (quality + price). To charge more, you just have to be able to prove that the increased price is worth it…to an increasingly informed consumer…who can compare similar products and prices from a variety of retail channels while standing in the retail aisle. The Service Segments have the opposite problem… as prices continue to spiral upward. A high inflation rate may increase revenue as consumers pay more but it can and will eventually limit the appeal, resulting in a reduced market penetration and ultimately a reduction in the amount of services sold.
With all this “turmoil”, the projected inflation rate for Total Pet is a reasonable 1.1%!
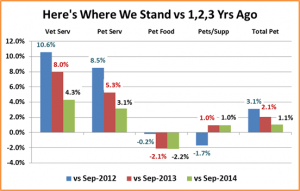
This last chart should help compare the recent up/down performance of each segment:
The turnaround for Supplies is apparent. You can also see the ongoing deflation problem in Food. Prices are even slightly below 3 years ago. The rising prices in the Service Segments are accelerating in 2015 and a big contrast to the Product Segments. I really like this chart as a visual reminder to look closer at what is producing the numbers in any analysis of data. The Total Pet numbers look very calm and controlled with an annual inflation rate of about 1%. However, when you look below the surface you see the turmoil in the segments that produced these “calm and controlled” overall numbers.


