Pet Market Growth – How much is “real”? – Part 3 – The bottom line.
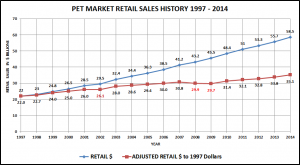
The Retail Pet Market has grown from $22B in 1997 to $58.5B in 2014 – a 165.9% increase. At the same time prices in the industry have gone up 66.8%. How do you factor out the price increases to show the growth in terms of the actual amount of goods and services sold?
One way is to use the CPI published by the USBLS to adjust each year’s retail sales back to 1997 ($) Dollars (the base year).
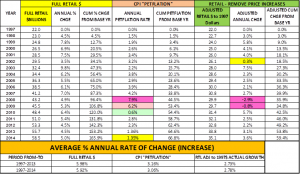
When you do that you get a spreadsheet that looks like this:
A lot of details! We can refer back to this chart to reference specifics. Let’s look at the Bottom Line in a more visually friendly way.
Here you go: The Pet Market from 1997 to 2014 – Full Retail and Adjusted to 1997 $ (removing price increases)
Let’s pull this all together with a brief summary of the 1997 – 2014 history
Overall growth
- Full Retail Sales – 165.9% (Average annual retail growth 5.92%)
- Petflation – 66.8% (Average annual price increase 3.06%)
- More than half of the industry’s average annual growth came from price increases
- Adjusted Growth Taking out price increases – 59.4% (Average “actual” growth 2.78%)
Petflation
- Driven by huge increases in Veterinary Services (125%) and Other Services (75%)
- Pet Food Price increases are close to those for Human Food & Beverage
- Pets and Supplies have only increased by 14% in 17 years.
Key Waypoints
- 2002 – The first year that the Petflation rate exceeded the National CPI
- The result – actual increase in the amount of Pet Goods and Services only 0.3%
- 2008 & 2009 – The 2 largest price increases in the 17 year history
- Retail Sales went up in 2008 but Consumers BOUGHT LESS – they just paid more.
- Retail Sales also increased in 2009 but Consumers BOUGHT EVEN LESS – paid even more.
- 2010 – Prices continue upward in Services but drop in Food and Supplies. Net increase: 0.6%
- The consumers respond with renewed purchasing vigor. Adjusted growth rate is the largest in 7 years and the third largest in the 17 year period.
- 2011 > 2014 – Service prices continue to go up rapidly but Food price increases come back to a more reasonable rate. Supply prices stabilize and even fall further.
- Price increases now represent less than half of the average annual growth %.
So… “How much of the growth is real?” Obviously, in terms of full retail dollars, the growth is all real. You can take it to the bank. However, more than 50% of the average annual growth has come from price increases, not from increased sales of goods and services. The resulting price adjusted annual growth rate of 2.8% still indicates a moderately strong Pet Market.
It should also be noted that like other markets, Pet does have price sensitivity. While Retail Sales have increased every year, large price increases in the Recession years resulted in consumers buying less – usually not a good plan for long term growth. The good news is that they have responded positively to subsequent price drops and a continuing moderate rate of increase in the CPI.
Of concern is the continued high rate of price increases in the Veterinary Segment. When will the consumer react? On the other end of the spectrum, will deflation continue in the Supplies Segment. This will put added pressure on manufacturers.
In our next post we will begin a detailed look at the period from 2009 to 2014. This recent history has the most relevance to the continued growth of the market .


Trackbacks & Pingbacks
[…] the US alone, the pet industry has doubled in value since 2002 and by 2014 was worth $58.5 billion a year. Taking the …read […]
[…] the US alone, the pet industry has doubled in value since 2002 and by 2014 was worth $58.5 billion a year. Taking the lead from their owners, there’s also a huge pet obesity crisis across the pond, where […]
[…] In the next post we will blend the CPI increase with the Retail sales, factor out price increases and show the performance of the market in terms of the amount of Pet Supplies and Services sold. […]
Comments are closed.