2018 U.S. VETERINARY SERVICES SPENDING $21.23B…UP ↑$0.56B
Veterinary Services is the second largest segment in the Pet Industry. In recent years, a high inflation rate, over 3.5%, caused a reduction in Veterinary visits and put spending on a roller coaster ride. In 2017 inflation slowed markedly (+2.2%) and consumers responded. In 2018 prices turned upward (+2.6%) and spending plateaued. Veterinary Services Spending in 2018 reached $21.23B – Up -$0.56B (+2.7%) from 2017, but “real” growth (adjusted for inflation) was only 0.1%. In this report, we’ll take a closer look at the demographics behind the 2018 numbers. (Note: All 2018 numbers in this report come from or are calculated by using data from the US BLS Consumer Expenditure Interview Survey, rather than their Diary report. The low frequency of Veterinary Visits is still generating an exceptionally high variation on the data collected by the Diary method. Interview seems to be a more logical and accurate way to track Veterinary Service Expenditures.)
Let’s get started. Veterinary Spending per CU in 2018 was $161.51, up slightly from $159.01 in 2017. (Note: A 2018 Pet CU (67%) Spent $241.06) More specifically, the increase in Veterinary spending came as a result of:
- 1.1% more CU’s
- Spending 1.8% more $
- …0.2% less often
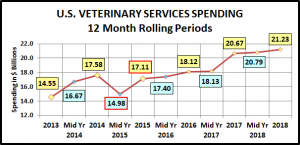
We’ll take a closer look. But first, the chart below gives an overview of recent Veterinary Spending.
The big spending drop in the first half of 2015 coincided with the upgrade to Super Premium Foods – Trading $. Then consumers began value shopping for Premium Foods. The subsequent savings freed up $ for Veterinary Services. Spending began to climb until it flattened out at the beginning of 2017. In 2017, Veterinary inflation slowed markedly in the second half. The result was that spending literally “took off”. In 2018 prices turned up again. Consumers responded by essentially “holding their ground”. There is definitely some price sensitivity in Veterinary Services Spending.
Now, let’s look at Veterinary spending by some specific demographics. First, here is a chart by Income Group. Outlined in Red, Spending was Down from 2017. If Green, Spending was Up. A Pink fill indicates that 2018 Spending was lower than 2014.
Although not as pronounced as Pet Services, Veterinary Spending is driven by income. The lowest income group cut back on spending while the all the other groups increased. The biggest lift came from the $150K+ group – up $0.64B (+11.2%)
- Over $150K (12.7% of CU’s) – $6.32B, Up $0.64B (+11.2%) This highest income group is definitely the biggest driver in Veterinary Spending as 12.7% of CU’s generated 30% of 2018 $ and 60% of the $4.12B increase since 2015.
- $100>150K (13.1% of CU’s) – $4.50B, Up $0.18B (+4.2%) This middle/upper income group responded strongly to the slowed inflation rate in 2017 but as prices turned up in 2018, their increase slowed
- $70K>100K (14.5% of CU’s) – $3.67B, Up $0.24B (+6.9%) Their spending pattern is relatively stable but responsive to the lower inflation rate since 2017.
- $30K>70K (31.0% of CU’s) – $4.95B, Up $0.27B (+5.8%) After bottoming out during the 2015 Food upgrade, the spending by this group has grown steadily. The pattern is remarkably similar to the $150K+ group, just not quite as strong.
- Under $30K (28.7% of CU’s) – $1.79B, Down -$0.77B (-29.9%) This group is very price sensitive. After an increase in all segments in 2017, they dialed back their pet spending, especially on Food and Veterinary Services in 2018.
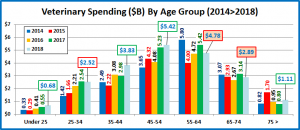
Now, here is Veterinary Spending by Age Group
The 25>34 Millennials spending was flat and the 55>74 yr olds, primarily Boomers, spent less. Everyone else spent more.
- <25 (5.8% of CUs) – $89.56 per CU – $0.68B – Up $0.13B (+22.7%) This youngest group is getting serious about the responsibilities of Pet Parenting. Their Veterinary spending has more than doubled in 3 years. (+134%)
- 25>34 (16.2% of CUs) – $118.36 per CU – $2.52B – Down -$0.02B (-0.9%) The commitment of these Millennials to their pets is growing. In 2018 they focused on the other segments as Veterinary $ stabilized after 3 annual increases.
- 0.1% more CUs
- Spent 5.3% less $
- …4.5% more often
- 35>44 (16.7% of CU’s) – $174.01 per CU – $3.83B – Up $0.84B (+28.3%) In 2017 this group had double digit increases in the other 3 Pet Industry segments. In 2018 it was the Veterinary segment’s turn as these mostly Gen Xers significantly ramped up the amount they spent on Veterinary Services.
- 4.3% more CUs
- Spent 27.1% more $
- …3.2% less often
- 45>54 (17.5% of CUs) – $234.93 per CU – $5.42B – Up $0.19B (+3.6%) This group has the highest income, but value is still a big driver. In 2017, the radically slowed inflation caused them to spend significantly more money and more often. In 2018, prices turned up. Their frequency slowed slightly but they still had a double digit increase in $ spent.
- 2.2% fewer CUs
- Spent 10.5% more $
- …4.1% less often
- 55>64 (18.6% of CUs) – $195.31 per CU – $4.78B – Down -$0.64B (-11.9%) This group is all Baby Boomers and until 2015 was the leader in Veterinary Spending. In 2015 they spent an extra $5B to upgrade their Pet Food and Veterinary Spending was severely reduced. In 2016, they regained the lead in Veterinary spending and held it until 2018 when their spending on both Food and Veterinary Services plummeted.
- 0.9% fewer CUs
- Spent 9.4% less $
- …1.8% less often
- 65>74 (14.7% of CUs) – $149.76 per CU – $2.89B – Down -$0.24B (-7.7%) This group is growing in numbers and very price sensitive. The pricing “slow down” in 2017 brought a big lift. As inflation turned up in 2018, their spending fell.
- 4.2% more CUs
- Spent 8.6% less $
- …3.1% less often
- 75> (10.4% of CUs) – $81.08 per CU – $1.11B – Up $0.31B (+38.9%) This group of oldest Pet Parents has a strong commitment to their pets – in 2015 a $1B increase in Veterinary Spending. In 2016, they upgraded their food. In 2017 they increased spending in Food, Supplies and Services. In 2018, they turned their attention back to Veterinary.
- 3.9% more CUs
- Spent 13.0% more $
- …18.4% more often
Now, let’s take a look at some other key demographic “movers” behind the 2018 Veterinary Spending numbers.
Veterinary spending increased by $0.56B (+2.7%) in 2018. Considering the 2.6% inflation rate, the “real” increase in the amount of Veterinary Services was only +0.1%. 2018 Veterinary Spending was truly a “mixed bag” as 47 of 82 demographic segments (57.3%) spent more on Veterinary Services while 35 segments spent less. In the chart you see the influence of income with “winners” like, $150K+, Self Employed and BA/BS degrees and “losers” like Under $30K, Retirees and 2+ People, No Earner CUs.
There were also some of the “usual” winners like Homeowners with mortgages and White, Not Hispanic CUs. However, that doesn’t tell the whole story. There were some truly surprising outcomes:
On the winning side:
- Single person CUs were the winner in 3 separate demographic categories – That never happens! They tend to have fewer pets and generally lower incomes.
On the losing side:
- Advanced College Degrees – Generally have higher income and spend more on their pets, especially on Veterinary.
- Married Couple Only – Traditionally the biggest pet spenders.
- Rural – Big spenders in Food and Veterinary
- Asian – Not big pet spenders but they do have the highest income, so it is not just about money.
You also see strong evidence that points a finger at Retirees for the decreases in spending including:
- Retirees: -$0.62B
- Homeowners w/o Mtge -$0.49B
- No earner, 2+ CUs -$0.39B
However, you run into a problem when you recall that the over 75 age group, virtually all retired, was up +$0.31B.
The answer is obvious – The Baby Boomers. After driving the growth of the Pet Industry since the 1980’s, the Boomers seem to have “stumbled”. Veterinary spending fell -$1.8B but their overall Pet Spending dropped -$6.5B. Some of this is related to their adult children moving out with their pets. However, it’s just possible that the “Boomer Age” may be starting to fade.
In Veterinary spending the younger groups definitely stepped up as the Gen Xers (+0.91B) narrowly edged out the Millennials (+0.82B) for the biggest increase. This explains the strong performance by Center City and Singles. Also, Unmarried, 2 adult CU’s spent $0.33B more and Married Couples with children were up +$0.58B – both younger groups.
Although the younger crew deserve most of the credit for the Veterinary $ increase, the “Silents” (1929 to 1945) weren’t far behind at +$0.55B. Even the 90+ year old Greatest Generation spent +$0.03B more. Pet parenting is a lifetime calling.
Boomers have the most CUs and are the $ spending leaders. They will be a force in the industry for years to come, but the Gen Xers are the now CU spending leader in Total Pet and all segments but food. They seem poised and ready to take their turn at the top.

