2017 Veterinary Spending was $20.67B- Where did it come from…?
Now we will move to the Service Segments – first up is Veterinary Services. We’ll see some big differences from the Product Segments. For years, Veterinary Services prices have had high inflation. This has resulted in CU income becoming the most dominant factor in spending behavior and a reduction in visit frequency. Consumers paid more, just used Veterinary Services less often. The high inflation and prices also resulted in consumers trading Veterinary $ in reaction to big spending changes in other segments, primarily Pet Food.
We have noted that 2017 was different. It was a year of Value. This was also true in the Veterinary segment. While prices did not deflate, inflation hit an all time record low rate. Consumers reacted by spending $2.56B (+14.1%) more on Veterinary Services. The best news was that half of the increase came from an increase in frequency of visits, +7.2%.
Let’s see which groups were most responsible for the bulk of Veterinary spending in 2017 and the $2.56B increase. The first chart details the biggest pet Veterinary spenders for each of 10 demographic categories. It shows their share of CU’s, share of Veterinary spending and their spending performance (Share of spending/share of CU’s). The differences from the product segments are immediately apparent. In order to better target the bulk of the spending we have altered the groups in three categories – income, occupation & age. Another big difference is the performance – 7 of 10 groups perform above 120%. This down from 8 in 2016 but is more than Supplies – 6 and Food – 5. This means that these big spenders are truly performing well but it also signals that there is a far larger disparity between the best and worst performing segments. Income is clearly the biggest factor in Veterinary Spending. The categories are presented in the order that reflects their share of Total Pet Spending which highlights the differences of the 7 matching categories.
- Race/Ethnic – White, not Hispanic (90.0%) down from (92.0%) This group accounts for the vast majority of spending in every segment., but a 90% share is extraordinary. The 131.4% performance rating ranks #3 in terms of importance in Veterinary Spending demographics and reflects the spending disparity. Hispanics, African Americans and Asians account for 31.5% of U.S. CU’s, but they only spend 10% of Vet $. Asians and African Americans have significantly a lower percentage of pet ownership and African Americans have the lowest average CU income.
- # in CU – 2+ people (84.1%) up from (79.4%) They had a big gain in share and their performance increased from 112.9% to 118.0%. The performance increase moved them up in importance from last to 8th. The gain in share was driven by increased spending by 2 and 3-person CUs while the performance increase came from a spending drop by Singles. This widened the disparity between segments.
- Housing – Homeowners (82.5%) up from (81.7%) Homeownership is a major factor in pet ownership and spending in all industry segments. In terms of importance to increased Veterinary spending, the 131.2% performance rating keeps homeownership in 4th place. Both the share of market and performance increased slightly in 2017. This was driven by a big increase in spending by Homeowners without a Motgage. We should note that Homeownership is not as important to Veterinary Spending as it once was. In 2015 their share was 88.4% with performance of 141.8%.
- Education – Associates Degree or Higher (73.8) down from (74.1%) Income generally increases with education. It is also important in understanding the need for regular Veterinary care. Market share was down slightly as was performance, which dropped from 143.2% to 137.4%. However, it is still the 2nd most important factor in Vet spending. The drops were primarily due to a 27.6% increase from HS Grads w/some College – largest in the category.
- Age – 45>74 (66.7%) up from (63.3%) Although the younger groups have made Veterinary Spending more of a priority, in 2017 a slight drop by the 35>44 yr olds combined with a lift from the 65>74 group resulted in a change in age range for the big group. This along with a big spending lift from the 45>64 age range generated the increase in share. The performance had an even bigger increase, going from 121.0% to 129.8%. This moved the importance of Age in increased Veterinary Spending up from 7th place to 5th.
- Occupation – I’m the Boss (65.9%) up from (64.4%) –“I’m the Boss” includes Mgrs & Professionals, Self-employed and Retirees and has a bigger market share than all wage and salary earners. In 2017, all of the “regular” workers spent more but Mgrs/Professional and Retirees drove the increase. The share gain was minimal due to a spending drop from Self-employed. Even with 129.0% performance. They fell from 5th to 6th in importance.
- # Earners – “Everyone Works” (65.9%) down from (69.2%) In this group, all adults in the CU are employed. Even with a loss, the market share of Veterinary $ is the largest share for this group in any segment. Performance fell to 115.0% from 120.1%, which dropped them out of the 120% club. The drop came as a result of a huge increase from 1 Earner, 2+ CUs, with some help from No Earner, 2+ CUs.
- Income – Over $70K (65.0%) up from (63.0%) We changed this group from over $50K because Veterinary Spending is so affected by CU income and the $70K level is where the behavior changes. Although the $50>69K had a 27.3% increase, the Over $70K produced 79% of the increase ($2B). The 169.1% performance clearly shows that higher income is THE most important factor in increased Vet spending.
- CU Composition – Married Couples (63.8%) up from (61.3%) Married couples have a big market share and 120+% performance in all segments. They gained share due to a big increase from Couples only and a drop from singles. Other categories did better so a performance of 128.9% caused them to fall from 6th to 7th place in importance.
- Area – Suburban (62.9%) up from (62.3%) Suburban CU’s are the biggest spenders in every segment. They gained in share– taken from Central Cities, but fell a little in performance to 113.1%. due to a 41% increase from Rural Areas.
We changed 3 of the spending groups for Veterinary to better target the biggest spenders. Higher income is by far the biggest single factor in Veterinary spending. We see the impact of this in many groups as it often contributes to the big spending disparity between segments. The most notable changes were that the # of Earners became less important and spending skewed a little older.
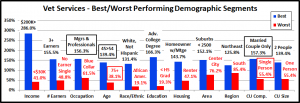
Now, we’ll look at 2017’s best and worst performing Veterinary spending segments in each category.
Almost all of the best and worst performers are those that we would expect. However, there are 5 that are different from 2016. This is more than Supplies (3) but less than Food (7). However, 4 of the 5 changes were in just two categories. This indicates a greater stability in the overall market spending performance. The changes from 2016 are “boxed”. We should note:
- Income – The 286.0% Performance by the $200K> group is down from last year’s 325.3% but is still very high. The low inflation rate may be closing the disparity gap a little, at least in the middle-income groups.
- Occupation – Mgrs & Professionals took over as the highest income occupation from the Self-employed. It makes sense that they would become the best performers in Veterinary Spending. Blue-Collar workers, with the lowest income of any working group, remain at the bottom with their performance staying in the 60+% range.
- Age – The 45>54-year olds, the group with the highest income, are back on top. They just edged out the 54>64-year olds for the win. The worst performing spot switched from the youngest Americans, <25, to the oldest, 75+.
- CU Composition – It was a strong year for Married Couples Only in all segments, but they had their biggest % increase in Veterinary, +30.6%. Singles had the opposite kind of year and replaced Single Parents on the bottom.
- # in CU –In 2017, the performance of 2 Person CU’s increased from 130.5% to 139.4%. The gap between them and Singles increased from 61% to 80%. Only 2 and 3 Person CUs perform above 100%.
- Region – Northeast won again – 3 straight years and passed 120%. The West is the only other region to exceed 100%
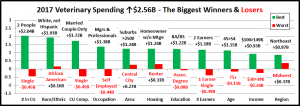
It’s time to “Show you the money”. Here are segments with the biggest $ changes in Veterinary Spending.
2017’s increase of $2.6B built on the $1B lift in 2016. While 16 winners and losers changed, this was much less than in any other segment. 4 segments flipped from 1st to last or vice versa, once again an industry low. With the exception of Self-employed, there were no real surprises. In 4 categories, all segments spent more. Last year there were none. This appears to be a sign of more stable growth. Here are the specifics:
- # in CU – 2 and 3 Person CUs drove the spending lift.
- Winner – 2 People – Veterinary: $9.85B; Up $2.04B (+26.1%)
- 2016: 4 People
- Loser – Single – Veterinary: $3.29B; Down $0.45B (-11.9%)
- 2016: 3 People
- Comment: 4 Person CUs also spent more. Only 5+ CUs and Singles spent less.
- Winner – 2 People – Veterinary: $9.85B; Up $2.04B (+26.1%)
- Race/Ethnic – With a 90% share of total Veterinary $, any % increase by White, non-Hispanics means big $.
- Winner – White, Not Hispanic – Veterinary: $18.60B; Up $1.93B (+11.6%)
- 2016: White, Not Hispanic
- Loser – African American – Veterinary: $0.52B; Up $0.16B (+44.5%)
- 2016: African Americans
- Comment – All groups in this category spent more on Veterinary Services. While White, non-Hispanics drove the $, the minority groups drove the percentage increase. Combined they spent 43.1% more.
- Winner – White, Not Hispanic – Veterinary: $18.60B; Up $1.93B (+11.6%)
- CU Composition – Married Couples Only had a big year in spending, including Veterinary.
- Winner – Married, Couple Only – Veterinary: $7.34B; Up $1.72B (+30.6%)
- 2016: Married, Oldest Child 6>17
- Loser – Single – Veterinary: $3.29B; Down $0.45B (-11.9%)
- 2016: Single
- Comment – It was definitely a mixed spending bag in this category. In addition to Singles, Married Couples with an oldest child over 18 or under 6 spent less. Those with an oldest child between 6 and 17 spent more along with single parents. However, you can make a case that 2017 was a year focused on “Adults only”. CU’s with 2+ Adults, married and unmarried spent $2.75B more on Veterinary Services.
- Winner – Married, Couple Only – Veterinary: $7.34B; Up $1.72B (+30.6%)
- Occupation – Mgrs. & Professionals continue to lead the way.
- Winner – Mgrs. & Professionals– Veterinary: $7.98B; Up $1.38B (+20.8%)
- 2016: Mgrs & Professionals
- Loser – Self-Employed – Veterinary: $1.47B; Down $0.44B (-31.8%)
- 2016: Retired
- Comment – Only Self-Employed spent less and about one third of their decrease came as a result of fewer CUs. Retirees spent $1B more and even Blue-Collar workers had a 10% increase.
- Winner – Mgrs. & Professionals– Veterinary: $7.98B; Up $1.38B (+20.8%)
- Area Type – All Areas spent more but the larger Suburbs, over 2500 pop., were the $ leader.
- Winner – Suburbs >2500 – Veterinary: $9.84B; Up $1.24B (+14.4%)
- 2016: Central City
- Loser – Central City – Veterinary: $5.69B; Up $0.27B (+4.9%)
- 2016: Rural
- Comment – Rural CUs spent 41% more. In fact, areas under 2500 pop. had a combined increase of $1B.
- Winner – Suburbs >2500 – Veterinary: $9.84B; Up $1.24B (+14.4%)
- Housing – All Segments had increased spending, but Homeowners w/o a Mtge won the race.
- Winner – Homeowner w/o Mtge – Veterinary: $6.29B; Up $1.24B (+24.5%)
- 2016: Renter
- Loser – Renter – Veterinary: $3.62B; Up $0.31B (+9.3%)
- 2016: Homeowner w/Mtge
- Comment – The big lift in spending by Retirees was a major factor in the increase by Homeowners w/o Mtge. Homeowners w/Mtge had a $1B increase after a -$0.9B drop in 2016. Renters flipped to last but still spent more.
- Winner – Homeowner w/o Mtge – Veterinary: $6.29B; Up $1.24B (+24.5%)
- Education – Those with a BA/BS Degree led the way and are up $1.58B since 2015.
- Winner – BA/BS Degree – Veterinary: $7.15B; Up $1.22B (+20.6%)
- 2016: Associates Degree
- Loser – Associates Degree – Veterinary: $2.21B; Down $0.08B (-3.4%)
- 2016: Adv. College Degree
- Comment – Associates Degree flipped from first to last but the drop was minor. Only one other segment had a decrease, < HS Grads. HS Grads w/some College had the biggest percentage increase, up 27.6%.
- Winner – BA/BS Degree – Veterinary: $7.15B; Up $1.22B (+20.6%)
- # Earners – 2 Earner CUs narrowly edged out 1 Earner, 2+ CUs for the win.
- Winner – 2 Earners – Veterinary: $8.79B; Up $1.18B (+24.1%)
- 2016: 2 Earners
- Loser – 1 Earner, Single – Veterinary: $2.02B; Down $0.39B (-16.2%)
- 2016: 1 Earner, 2+ CU
- Comment – The 1 Earners, 2+ CU group finished second but had a great year, up $1.13B (+42.9%). The No Earner, 2+ CUs were also up an impressive 24.1%. It wasn’t a good year for singles. Single CUs with 1 earner or No earner were the only segments with decreased spending. This data shows why the number of Earners in a CU mattered less in 2017 and why the “Everyone Works” group fell out of the 120% performance club for Veterinary spending.
- Winner – 2 Earners – Veterinary: $8.79B; Up $1.18B (+24.1%)
- Age – In 2017, the highest income group, 45 to 54 yr. olds had the biggest increase.
- Winner – 45>54 yrs – Veterinary: $5.23B; Up $1.15B (+28.3%)
- 2016: 35>44 yrs
- Loser – 75+ yrs – Veterinary: $0.80B;Down $0.15B (-15.7%)
- 2016: 75+ yrs
- Comment: The Veterinary spending increase was widespread as the 35>44 group had the only other minor decrease, -3%. The Under 35 age range had a second consecutive increase. However, overall Veterinary spending “spun” a little older as the 45>74-year olds were up $2.17B, 84.9% of the overall increase.
- Winner – 45>54 yrs – Veterinary: $5.23B; Up $1.15B (+28.3%)
- Income – In 2017, $100 to $149K was the winner. This victory usually belongs to an even higher income group.
- Winner – $100 to $149K – Veterinary: $4.32B; Up $0.93B (+27.4%)
- 2016: $200K>
- Loser – $30 to $39K – Veterinary: $1.30B; Down $0.24B (-15.4%)
- 2016: $40 to $49K
- Comment – The only other group to spend less was $200K+, a bit of a surprise, to say the least.
- Winner – $100 to $149K – Veterinary: $4.32B; Up $0.93B (+27.4%)
- Region – The Northeast flipped from last to first and all groups had an increase.
- Winner – Northeast – Veterinary: $4.66B; Up $0.87B (+22.9%)
- 2016: West
- Loser – Midwest – Veterinary: $4.20B; Up $0.37B (+9.7%)
- 2016: Northeast
- Comment – The South was a close second, up $0.85B.
- Winner – Northeast – Veterinary: $4.66B; Up $0.87B (+22.9%)
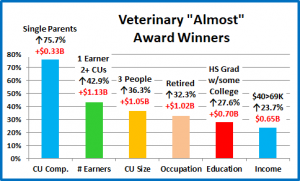
We’ve now seen the winners and losers in terms of increase/decrease in Veterinary Spending $ for 11 Demographic Categories. 2017 had strong growth in Veterinary spending, with fewer surprises than we saw in the products segments. Most of the winners were expected. However, while doing our analysis we saw indications that the growth was becoming somewhat more widespread. First and foremost of these, was the fact that 4 categories had no segments that spent less. However, there were also “hidden” segments that didn’t win but made a significant contribution to a successful 2017. These groups don’t win an award, but they certainly deserve….
HONORABLE MENTION
These segments all earned recognition. It is especially great to see the big increase from Single Parents. The other segments all testify to a deeper penetration of the $2.56B lift in Veterinary spending in many categories. In fact, only 18 of 99 segments spent less on Veterinary Services. That means that 82% spent more. We also have suggested that 1 Earner, 2+ CUs, HS Grads w/some College and the $40>69K income group were likely candidates to have increased Pet Ownership. An Increase in Veterinary spending supports that idea.
Summary
In 2015 and 2016 we saw a flip flop in Veterinary Spending – down the first year then up the next, as consumers traded $ with the Pet Food segment. In 2017 we had a unique situation in the industry. It was a year of value in all segments and the consumers took advantage of the situation. In the Veterinary segment we saw record low inflation. Consumers increased both the $ spent and visit frequency. This produced a $2.56B (14.1%) increase.
Veterinary services and spending should be a definite need, like Food, but there are many indications that it is becoming more discretionary and determined by income. It is very obvious when we look at performance. (Share Vet $/Share CUs)
<$30K – 41.0%
$30>50K – 62.5%
$50>70K – 80.9%
$70>99K – 111.7%
$100>149K – 164.5%
$150>199K – 218.3%
$200K> – 286.0%
The “break even” point (100%) occurs at $70K+. CU’s over $70K (38.4%) account for 65% of Veterinary $. In 2017 this group grew in numbers and gained share. Performance fell minimally from 170% to 169% due to a strong performance by the $40>69K group but there were no big changes like we saw in Food.
The performance of other big spending groups is also very important in the Veterinary segment. We identified seven demographic categories with high performing large groups. (There were only 6 for Supplies and 5 for Food) . Consumers have no control over Race/Ethnicity or Age but in addition to Income, Education, Homeownership, Occupation and Marriage are important factors in Veterinary spending. The high performance in these groups also demonstrates the big spending disparities among segments within these categories.
We saw very little change in these groups. There were 3 changes of note. The “Everyone Works” group lost market share and dropped out of the 120% club due to a strong year from 1 Earner – 2+ CUs and Retirees. The 2+ CU group had increased performance and disparity due to a strong year for 2 & 3 person CU’s and bad performance by singles. Veterinary spending also skewed older in 2017 so the big group changed from 35>64 to 45>74.
2017 was a strong year for the Veterinary segment and relatively balanced. 82% of all segments increased spending and in 4 categories all segments spent more. However, the biggest increases came from expected sources – 2 Person CUs, Married Couple Only, Mgrs & Professionals, White, Non-Hispanics, Homeowners w/Mtge. There were some good performances from groups that showed that gains were also being made in the middle ground. 1 Earner- 2+CUs, HS Grads w/some College, $40>69K and less populated areas (<2500) spent more on Veterinary Services. Our analysis of Food and Supplies suggested increased pet ownership in these groups. The Veterinary data supports that premise.
Finally – The “Ultimate” Veterinary Services Spending Consumer Unit consists of 2 people – a married couple only. They are in the 45 to 54 age range. They are White, but not of Hispanic origin. At least one of them has an advanced College Degree. Both of them work in Managerial positions and their total income exceeds $200K. They live in a small suburb, adjacent to a big city in the Northeastern U.S. and are still paying off the mortgage on their home.


