2017 U.S. TOTAL PET SPENDING $77.13B…UP ↑$9.84B
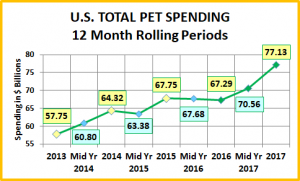
In 2017 Total Pet Spending in the U.S. was $77.13B, a $9.84B (14.6%) increase from 2016. There was almost universal good news. The movement to Super Premium Foods made a deeper penetration across demographics. Deflating prices in the Supplies Segment spurred spending. Veterinary prices had record low inflation which increased spending AND visit frequency. The only “bad” news came from a minor decrease in Services spending. Increased competition saw consumers shopping for value. Their purchase frequency on Services was up a bit. They just paid a little less. Trading $ between segments was not a big factor in 2017. Food had a big turnaround. Supplies and Veterinary built upon a spending increase that began in 2016. Only Services was down, for the first time since 2010. Here are the $ changes:
- A big $4.61B (+17.4%) turnaround in Food
- A $74B (+17.3%) lift in Supplies
- A $2.56B (+14.1%) increase in Veterinary
- A very unusual –$0.07B (-1.0%) drop in Services
Let’s see how these numbers blend together at the household level. In any given week, 28.4 Million U.S. Households (1/5) spent money on their Pets – food, supplies, services, veterinary or any combination – up from 27.1M in 2016.
In 2017, the average U.S. Household (pet & non-pet) spent a total of $593.63 on their Pets. This was a 14.3% increase from the $519.57 spent in 2016. However, this doesn’t “add up” to a 14.6% increase in Total Pet Spending. With additional data provided from the US BLS, here is what happened.
- 0.3% more H/H’s
- Spent 9.5% more $
- 4.3% more often
If 68% of U.S. H/H’s are pet parents, then their annual H/H Total Pet Spending was $872.99.
Now, let’s look at the recent history of Total Pet Spending. The rolling chart below provides a good overview. (Note: All numbers in this report come from or are calculated by using data from the US BLS Consumer Expenditure Surveys – The 2016 & 2017 Totals include Veterinary Numbers from the Interview survey, rather than the Diary survey due to high variation)
- In 2015, the Food upgrade began, but early in the year consumers were trading $ in other segments to pay for it.
- In 2016, they were intensely value shopping for super premium foods. They started spending some of this saved money on Supplies and Veterinary Services, but not quite enough as spending fell slightly for the year.
- In 2017, the Industry showed its true strength. Spending took off in all but Services, especially in the second half, when it was up $6.57B from the same period in 2016. Consumers found the money and spent it on their Pets.
Now we’ll look at some Demographics. First, 2017 Total Pet Spending by Income Group
All Income Groups increased Total Pet Spending!
- < $70K – (61.6% of U.S. H/Hs); H/H Pet Spending: $393.93, +13.6%; Total $: $31.37B, ↑$2.98B (+10.5%)..
- Food ↑$1.88B
- Supplies ↑$0.90B
- Services ↓$0.33B
- Veterinary ↑$0.53B
- The move to Super Premium Food became more widespread across all incomes. You also see the positive impact of price deflation in Supplies and record low inflation in Veterinary Services. Money matters a lot to this group. Value Shopping is a necessity and they also “traded” some Services $ to pay for other increases.
- >$70K – (38.4% of U.S. H/Hs); H/H Pet Spending: $911.26, +11.7%; Total $: $45.76B, ↑$6.86B (+17.6%) from…
- Food ↑$2.73B
- Supplies ↑$1.84B
- Services ↑$0.26B
- Veterinary ↑$2.03B
- This group continues to grow, up 4.2% in 2017. This magnifies the impact of increased household spending. They also show that income remains the single biggest factor in Pet Spending. 38% of households spent 59% of Total Pet $. They spent significantly more in all segments and accounted for 70% of the Total Pet increase.
- < $30K – (30.2% of U.S. H/Hs); H/H Pet Spending: $286.42, +10.1%; Total $: $10.91B, ↑$0.63B (+6.1%) from…
- Food ↑$0.42B
- Supplies ↑$0.09B
- Services ↑$0.004B
- Veterinary ↑$0.12B
- This lowest income group truly shows just how great 2017 was for the Pet Industry as they registered increases in every segment, even Services.
- $30>$70K – (31.4% of H/Hs); H/H Pet Spending: $492.83, +15.2%; Total $: $20.46B, ↑$2.35B (+13.0%) from…
- Food ↑$1.46B
- Supplies ↑$0.81B
- Services ↓$0.33B
- Veterinary ↑$0.41B
- This low to middle income group is by necessity price sensitive, but is also committed to their pets. The drop in Services spending came from a combination of trading $ and value shopping in a competitive market.
- $70>$99K – (14.9% of H/Hs); H/H Pet Spending: $697.80, +13.0%; Tot $: $13.41B, ↑$1.89B (+16.4%) from…
- Food ↑$0.99B
- Supplies ↑$0.25B
- Services ↑$0.05B
- Veterinary ↑$0.60B
- This upper middle income group also had across the board increases but their primary focus was on the more “necessary” segments. They upgraded their food and increased their Veterinary visits.
- $100K>$149K– (12.7% of H/Hs); H/H Pet Spend: $900.95, +22.3%; Tot $: $15.02B, ↑$3.32B (+28.4%) from…
- Food ↑$1.59B
- Supplies ↑$0.44B
- Services ↑ $0.37B
- Veterinary ↑$0.93B
- We should probably start calling them the “swing” group. In 2015 they were the Star of the income groups. In 2016, they had the worst performance with decreased spending in every segment. In 2017 they are back on top again. This probably indicates that they are the most responsive to industry trends. They have the money to do what is needed or what they want, but are still very “value” conscious.
- $150K> – (10.9% of H/Hs); H/H Pet Spending: $1214.05, +2.5%; Total $: $17.33B, ↑$1.65B (+10.5%) from…
- Food ↑$0.16B
- Supplies ↑$1.15B
- Services ↓$0.16B
- Veterinary ↑$0.50B
- Money Matters ! They are the proof. They are the best performing income group in Total Pet Spending with 10.9% of U.S. Households generating 22.5% of all Pet $. They are also the only income group to increase annual Pet Spending every year since 2014. The slight dip in Services spending actually makes sense. They spend 35% of all Pet Services $ so they are the most likely to be aware of “deals” in the highly competitive market. They didn’t reduce their purchase frequency. They just paid less. Actually, it even gets worse/better as income goes even higher. The over $200K segment of this group is the runaway best performer in every industry segment and generates 13.2% of all Pet $ from only 5.5% of the households.
Income Recap – The #1 driver in consumer spending behavior is value. VALUE = QUALITY + PRICE. 2017 was a year of great Value in the Pet Industry. All four industry segments matter to Pet Parents and income is the most impactful demographic in spending so it often comes down to “price”. In 2015 we saw a strong move to high priced Super Premium Pet Foods. By 2017, the price had come down so the movement spread. 2017 also saw deflating Supplies prices, a record low inflation rate in Veterinary Services and extraordinary retail competitive pressure in Services. All of this “price” pressure served to substantially increase the “value” in every segment. U.S. consumers recognize and respond to Value. In 2017, they did…in a big way in Pet Spending…across all income groups!
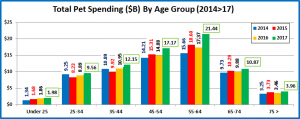
Next let’s look at the 2017 Total Pet Spending by Age Group
All groups spent more but the groups over 35 led the way with double digit increases.
- <25 – (5.8% of U.S. H/Hs); H/H Pet Spending: $258.82, +9.1%; Total $: $1.99B, ↑$0.12B (+6.6%) from…
- Food ↓$0.20B
- Supplies ↑$0.14B
- Services ↑$0.04B
- Veterinary ↑$0.14B
- This youngest group is just getting started in life and as Pet Parents. In 2017 they value shopped for food but increased spending in all other segments. They are the only group to increase Pet $ every year since 2014.
- 25-34 – (16.4% of U.S. H/Hs); H/H Pet Spending: $446.83, +6.4%; Total $: $9.56B, ↑$0.67B (+7.5%) from…
- Food ↓$0.08B
- Supplies ↑$0.41B
- Services ↓$0.002B
- Veterinary ↑$0.34B
- These oldest Millennials are just starting their families and careers so they are prone to trading $ between segments. However, they have shown slow, but steady spending growth since 2015.
- 35-44 – (16.2% of H/Hs); H/H Pet Spending: $579.89, +12.9%; Total $: $12.155B, ↑$1.20B (+11.0%) from…
- Food ↑$0.80B
- Supplies ↑$0.36B
- Services ↑$0.13B
- Veterinary ↓$0.10B
- This group has the largest families and is in the middle of building their careers. This makes them very sensitive to value. They responded to the opportunity in 2017. The decline in Veterinary comes after a 38% increase in 2016 and is the result of just paying less. Their spending frequency actually increased.
- 45-54 – (18.1% of U.S. H/Hs); H/H Pet Spending: $729.90, +17.7%; Total $: $17.17B, ↑$2.29B (+15.4%) from…
- Food ↑$0.74B
- Supplies ↑$0.56B
- Services ↓$0.17B
- Veterinary ↑$1.15B
- This group has the highest income but still appreciates value. They responded strongly to the values in 2017, especially Veterinary. They also increased their frequency in Services but got good deals so they spent less.
- 55-64 – (19.0% of U.S. H/Hs); H/H Pet Spending: $866.44, +21.3%; Total $: $21.44B, ↑$4.07B (+23.5%) from…
- Food ↑$2.83B
- Supplies ↑$0.82B
- Services ↓$0.28B
- Veterinary ↑$0.71B
- These Baby Boomers learned about value shopping in 2016 from Super Premium Pet Foods. They have applied that knowledge across the board. The drop in Services comes after a 54% increase in 2016. Plus, 90% of the decrease just comes from paying less. They have had a long standing commitment to all aspects of pet parenting, which is once again demonstrated with a $4B (23.5%) increase in what was already the highest level of pet spending.
- 65-74 – (14.3% of U.S. H/Hs); H/H Pet Spending: $585.83, +6.0%; Total $: $10.87B, ↑$0.99B (+10.0%) from…
- Food ↑$0.26B
- Supplies ↑$0.20B
- Services ↑$0.07B
- Veterinary ↑$0.46B
- Many in this group are retired and now over half are Baby Boomers. Their commitment to their pets along with their new found skill in value shopping really shows. They don’t have as much money as the younger Boomers but they were the only age group to increase spending in every industry segment.
- 75> – (10.2% of U.S. H/Hs); H/H Pet Spending: $303.60, +13.9%; Total $: $3.96B, ↑$0.50B (+14.5%) from…
- Food ↑$0.25B
- Supplies ↑$0.25B
- Services ↑$0.15B
- Veterinary ↓$0.15B
- Pet Parenting is more difficult and money is tight for these oldest Pet Parents but their commitment is still there. They increased spending in 3 of the 4 industry segments. In Veterinary, their frequency was virtually unchanged. They just spent less. This could be a combination of lower prices and a cut back on some services.
Age Group Recap: 2017 was a great year for the Pet Industry and the good news was widespread. Although the groups over 35 had the biggest increase, all age groups spent more on their Pets. There are two lower profile groups that deserve some special recognition and they are years apart. The 65>74 year olds were the only age group to have an increase in every industry segment. Plus, we can’t forget the youngsters. The under 25 households are the only age group to increase Total Pet Spending every year since 2014.
Even the few decreases in spending for individual segments were not primarily due to less frequent purchases. Consumers just spent less in a market “ripe” with great values.
Finally, let’s take a look at some Key Demographic “Movers” for 2017.
Summary
2017 was a spectacular year for the Pet Industry and the good news was widespread. This is immediately apparent from the chart. 7 of 10 demographic categories had no segments that spent less on their Pets in 2017. It gets even better. 87 of 92 individual segments (94.6%) increased their Total Pet Spending.
Many of the winners, like high income, managers, 2 people H/H’s, married couples only, 55>64 year olds and white, not Hispanics are familiar names in the winners’ circle. The same is true on the losing side for under $30K income, renters, center city, singles and married couples with an oldest child under 6.
There are two surprise winners, which further emphasizes the wide ranging impact of the spending lift. Specifically, 2+ person households with only one earner are usually under financial pressure. By the same token, high school graduates with some college are also not usually in the highest income tier. Both of these segments usually don’t have an excess of disposable income, but in 2017 they found some and generated the biggest Pet spending increase in their category.
On the “down” side, there is only one unexpected losing segment – self-employed. This high income segment had a bad year. In fact, they had the biggest spending decrease in 3 of the 4 industry segments. However, they had 8.9% fewer households, which was a big factor. Center City also came in last in 3 segments, but their only decrease was in Services.
6 of the 10 Total Pet winners had the biggest increase in 3 categories. Only 2 person households owned the top spot in all industry segments. With no human children, their focus and spending naturally turns to their pet children.
On the other side, Asians had small decreases in Food and Services but didn’t finish last in any individual segment. However, when you add up all their numbers, they had the lowest increase in Total Pet Spending.
As we noticed early on in our analysis, the key to the Pet Spending lift was “Value”, in every segment. Super Premium Pet Food was available at attractive prices. Pet Supplies Prices deflated, which always spurs consumers to spend more and more often. Veterinary prices, which have been strongly inflating for years fell to a record low rate. People not only spent more Veterinary $ but their frequency was significantly up. Services had a minor spending decrease. This came from the retail competitive pressure as the number of outlets offering services increased. Consumers maintained their frequency of visits but many got a “deal”.
What about 2018? If much of the big lift was driven by lower or “more acceptable” prices in every segment then the CPI could be a major factor. Through September of 2018, Pet Food prices have remained essentially stable. Veterinary prices have moved up to a more “normal” inflation rate. However, prices in both Services and Supplies turned sharply up in the second quarter. In general, this does not bode well for spending. However, it’s the pet industry. We’ll just have to wait and see.


