2017 U.S. PET SUPPLIES SPENDING: $18.58B…UP ↑$2.74B
2017 was a record setting year for the Pet Industry as spending soared to $77.13B, a $9.4B (14.6%) increase from 2016. The Supplies segment even exceeded this pace as spending reached $18.58B, a $2.74B (17.3%) increase. (Note: All numbers in this report come from or are calculated by using data from the US BLS Consumer Expenditure Surveys)
2017 continued and in fact, built on an upturn in Supplies spending which began in the second half of 2016. In this report we’ll “drill down” into the data to try to determine what and who are “behind” the huge spending lift in Supplies.
In 2017, the average household spent $142.90 on Supplies, up 16.9% from $122.25 in 2016. (Note: A 2017 Pet H/H (68%) Spent $210.00) This doesn’t exactly match the 17.3% total $ increase. Here are the specific details:
- 0.3% more H/H’s
- Spent 11.6% more $
- 4.7% more often
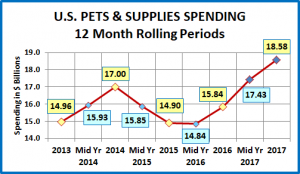
Let’s start with a visual overview. The chart below shows recent Supplies spending history.
Since the great recession, you can’t talk about spending trends in the Supplies segment without talking about price – the CPI. Although many supplies are needed by Pet Parents, when they are bought and how much you spend is often discretionary. Additionally, many of the product categories in this segment are now considered commodities, so price is the main driver behind consumer purchasing behavior. When prices fall, consumers are more likely to buy more. When they go up, consumers spend less and/or buy less frequently.
2014 was the third consecutive year of deflation in Supplies as prices reached a level not seen since 2007. Consumers responded with a spending increase of over $2B. Prices stabilized and then moved up in 2015.
In 2015 we saw how the discretionary aspect of the Supplies segment can impact spending in another way. When consumers spend a lot more $ in another segment, like for a food upgrade, they are likely to cut back on Supplies – swapping $. This is what happened in 2015. Many consumers upgraded their food, spending +$5.4B more. This gave them less to spend on other aspects of Pet Parenting. This, in conjunction with inflation, caused supplies to suffer as consumers spent 4.1% less, but they bought 10% less often. That seemingly small drop in purchase frequency (ex: Buy every 33 days instead of buying every 30 days) drove $1.6B (78%) of the $2.1B decrease in Supplies spending.
In 2016, supplies’ prices flattened out and consumers value shopped for their upgraded food. Supplies spending stabilized and began to increase in the second half. In 2017 supplies prices deflated, reaching a new post-recession low. The consumers responded with a huge $2.74B increase in Supplies spending that was widespread across demographic segments. An important factor in the lift was an increase in purchase frequency which is now within 5% of the 2014 rate.
That gives us an overview of the situation. Now let’s look at “who” was behind the big spending increase. First, we’ll look at spending by income level, the most influential demographic in Pet Spending.
In 2017 Supplies spending increased in every income segment. Here are the specifics.
- <$30K (30.2% of H/H’s) – $133.37 per H/H – $2.69B – Up $0.09B (+3.4%). This group obviously must closely watch their discretionary spending. They are also the only group to spend less in 2017 than in 2014. However, this somewhat deceptive as their H/H supplies spending actually increased 4%, but the number of H/H’s fell 8%.
- $30K>$70K (31.4% of H/H’s)- $126.35 per H/H – $5.15B Up $0.81B (+12.6%). This lower income group had a big drop in 2015. In 2016 they started to bounce back and in 2017 this accelerated with the 2nd biggest $ increase.
- $70>$100K (14.9% of H/H’s) – $157.21 per H/H – $3.04B Up $0.25B (+8.9%). This middle income group spends more than the national average on supplies and closely matches the national pattern but with smaller “swings”.
- $100K>$150K (12.5% of H/H’s) – $195.40 per H/H – $3.22B Up $0.43B (+15.4%) Except for a dip in 2016, the Supplies Spending in this group has been essentially flat. The drop in 2016 actually coincided with a drop in their total H/H expenditures. Value shopping is not limited to the lower income groups.
- $150K> (10.9% of H/H’s) – $316.35 per H/H – $4.47B Up $1.15B (+34.6%) With by far the biggest lift in both $ and in percentage, this group reinforces the importance of income in Supplies spending.
Please note that while the $150K+ group had the biggest increase, the 2nd spot belonged to the lower income $30>70K.
Now, we’ll look at spending by Age Group.
It’s the same story as the Income demographic. Every age group spent more on Supplies in 2017. Here are the specifics.
- 45>54 (18.1% of H/H’s) $179.90 per H/H – $4.24B – Up $0.56B (+15.3%) This highest income age group has been the leader in Supplies spending since 2007. Fewer H/H’s (-2.0%) spent 9.4% more on supplies, 7.5% more often.
- 55>64 (19.0% of H/H’s) $168.56 per H/H – $4.17B – Up $0.82B (+24.3%) A portion of this “Boomer” group dialed back their supplies spending while upgrading their food. In 2017 they came back strong as 0.3% more H/H’s spent 21.6% more on Supplies, 2.0% more often. The lowest Supplies prices (CPI) since 2007 were very alluring.
- 35>44 (16.2% of H/H’s) $165.53 per H/H – $3.49B – Up $0.36B (+11.5%) This group is second in income and overall expenditures. In 2016 these Gen Xers led the way with a big lift in Supplies spending which continued into 2017 when 1.7% fewer H/H’s spent 6.5% more $, 6.5% more often.
- 65>74 (14.3% of H/H’s) $132.12 per H/H – $2.45B – Up $0.20B (+8.7%) In 2016 they saved money on food and spent it on supplies. In 2017 growth continued as 1.8% more H/H’s spent 6.8% more, with the same frequency.
- 25<34 (16.4% of H/H’s) $118.54 per H/H – $2.52B – Up $0.41B (+19.4%) These Millennials are the only group spending less on Supplies in 2017 than in 2014. Their priorities have changed. They upgraded food and doubled veterinary spending. However, in 2017 2.0% more H/H’s spent 13.2% more on supplies, 3.4% more often.
- <25 (5.8% of H/H’s) $87.63 per H/H – $0.67B- Up $0.14B (+27.4%) This small group had 3.9% more H/H’s, spent 23% more $, but 0.4% less often. I think the big $ increase earns them a “pass” on the slightly lower frequency.
- 75> (10.2% of H/H’s) $78.79 per H/H – $1.04B, Up $0.14B (+31.9%) This group spends 15% more than they earn. The deflated supplies prices were very appealing as 1.4% more H/H’s spent 5.6% more, 23.1% more often.
Finally, let’s take a look some other key demographic “movers” behind the 2017 Pet Supplies Spending increase.
Summary
The big drop in spending in 2015 highlighted the vulnerability of a discretionary segment like supplies, especially through a small reduction in purchase frequency. However, the supplies segment provides many products which make the lives of pets and their “parents” easier and better, so we knew that a spending recovery was inevitable. The recovery began in the second half of 2016, as consumers “freed up” money by value shopping for their new upgraded food. Deflation in 2017 accelerated the process and spending passed the $17B level of 2014 by mid-year. By year end, spending had reached 18.58B. This was $1.58B more than 2014, $2.74B more than 2016 and $3.74B more than the spending low point in mid-2016. Purchase size was up significantly and spending frequency was 95% of 2014 – a more normal market.
If you would like more proof of “normalcy”, just look at the winners in the chart above. College Grads, Managers, Homeowners w/Mtge, $150K+ income and small Suburbs are all the “usual suspects” behind a lift in Supplies spending. However, the 2017 spending lift was almost universal. All income and age groups spent more and in fact, 89 of 94 demographic segments (94.6%) bought more supplies.
The $2.74B increase in Supplies spending was obviously great news, especially following the $0.94B increase in 2016. This gives the Supplies segment an average annual increase rate of 3% since 2014, which is not great, but is a return to more normal levels. How it happened does cause some concern as supplies prices deflated 0.4% in 2017. This may not sound like much but it did push them down to the level of 2007 and to a record 5.3% below their all-time high in 2009.
Deflation increases profit pressure on retailers and especially manufacturers. In Supplies, it appears that the only way to increase spending is to reduce prices. What happens if they go up? We’ll soon find out as prices rose sharply in the second quarter of 2018. In June of 2018 they were 1.85% higher than in December of 2017.


