2016 U.S. VETERINARY SERVICES SPENDING $18.12B…UP ↑$1.01B
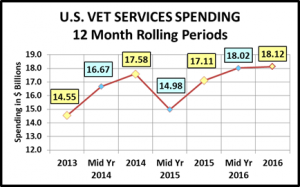
Veterinary Services is the second largest segment in the Pet Industry. A high inflation rate, over 3.5%, has put spending on a rollercoaster ride with today’s more price sensitive consumers. In 2016, spending was $18.12B – Up -$1.01B (+5.9%) from 2015. In this report, we’ll take a closer look at the demographic drivers of the increase. (Note: All 2016 numbers in this report come from or are calculated by using data from the US BLS Consumer Expenditure Interview Survey, rather than their Diary report. The low frequency of Consumers’ Veterinary Visits generated an exceptionally high variation on the data collected by the Diary method so I chose to use the data from their Interview survey. This seems to be a more logical and accurate way to track Veterinary Service Expenditures.)
Let’s get started. Veterinary Spending per H/H in 2016 was $139.84, up from $133.4 in 2015. (Note: A 2016 Pet H/H (65%) Spent $215.14) More specifically, the increase in total spending came as a result of:
- 0.9% more H/H’s
- Spending 1.2% more $
- …3.8% more often
We’ll need to take a closer look. But first, the chart below gives an overview of recent Veterinary Spending.
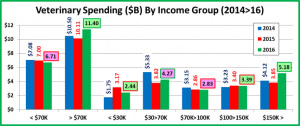
After the precipitous drop in the first half of 2015, spending began to climb until it flattened out in the second half of 2016. The 2015 Food spending upgrade and then the subsequent savings accrued by value shopping both affected the availability of funds for spending on Veterinary Services. Now, let’s look at Veterinary spending by some specific demographics. First, here is a chart by Income Group with these highlights:
- If outlined in green, sales were up in 2016
- If outlined in red, sales were down in 2016
- If highlighted in green, sales were up from 2014
- If highlighted in pink, sales were down from 2014
Observations
At first glance, the increases from 2015 and even from 2014 seem to be driven solely by the higher incomes, over $70K, which is not unexpected with the high inflation rate. Although when you look closer, the story becomes more complex.
- Over $150K (10.5% of H/H’s) – $5.18B, Up $1.33B (+34.6%) This highest income group is definitely the biggest driver as Veterinary Prices continue to inflate at a high rate.
- $70K>150K (26.5% of H/H’s) – $6.22B, Down -$0.04B (-0.6%) The spending is essentially flat in this mid to upper income group, although it is trending downward.
- $30K>70K (31.9% of H/H’s) – $4.27B, Up $0.45B (+11.6%) This is one bright spot in the below average income group. Among other demographics, it includes a number of younger H/H’s.
- Under $30K (31.1% of H/H’s) – $2.44B, Down -$0.73B (-23.0%) Obviously, this group is price sensitive and includes many retirees who spent heavily in 2015, then pulled back in 2016.
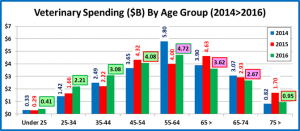
Now, here is Veterinary Spending by Age Group
Observations
It is immediately obvious that in 2016 the younger generations stepped up in terms of Veterinary Spending.
- <25 (5.6% of H/Hs) – $56.77 per H/H – $0.41B – Up $0.12B (+45.1%) This youngest group is beginning to recognize that being a Pet Parent is more than just buying Food and toys.
- 25>34 (16.1% of H/Hs) – $105.67 per H/H – $2.21B -Up $0.55B (+33.1%) These Millennials committed both to upgrading their Pet Food and spending more on regular Veterinary care. They have a long way to go but they are on the right track.
- 0.7% fewer H/Hs
- Spent 31.3% more $
- …2.0% more often
- 35>44 (16.6% of H/H’s) – $143.51 per H/H – $3.08B – Up $0.86B (+38.5%) This group is under tremendous financial pressure as their human family responsibilities are peaking. They valued shopped for premium food but used the saved money and more to get the products and Veterinary care that their pet children needed. In fact, they exceeded the National Average on Veterinary spending per household for the first time since 2010.
- 0.3% fewer H/Hs
- Spent 24.1% more $
- …11.9% more often
- 45>54 (18.6% of H/Hs) – $169.48 per H/H – $4.08B – Down -$0.24B (-5.6%) This group has the highest income but they too value shopped for premium Pet Food. In Veterinary Services, they did not cut back on frequency. They just spent slightly less.
- 0.8% fewer H/Hs
- Spent 5.3% less $
- …0.5% more often
- 55>64 (19.0% of H/Hs) – $191.38 per H/H – $4.72B – Up $0.72B (+18.0%) This group is all Baby Boomers and until 2015 was the leader in Veterinary Spending. In 2015 they spent an extra $5B to upgrade their Pet Food and Veterinary Spending was severely reduced. In 2016, they didn’t get back to 2014 levels, but they regained the lead in Veterinary spending by sharply increasing the frequency of their clinic visits.
- 2.3% more H/Hs
- Spent 0.4% more $
- …14.9% more often
- 65>74 (14.0% of H/Hs) – $146.93 per H/H – $2.67B – Down -$0.26B (-8.6%) This group is very price sensitive. As Veterinary prices continue to inflate, they continue to cut back on both the amount spent and frequency of visits.
- 5.0% more H/Hs
- Spent 4.7% less $
- …8.6% less often
- 75> (10.0% of H/Hs) – $72.97 per H/H – $0.95B – Down -$0.75B (-44.1%) In 2015 this group of oldest Pet Parents made a commitment to their pets with a $1B increase in Veterinary Spending. Spending on Food was radically reduced. In 2016, they chose to upgrade their Pet Food and Veterinary Spending suffered. They have a strong commitment to their pets but not enough money to “go around”
- 3.1% more H/Hs
- Spent 44.0% less $
- …3.3% less often
Now, let’s take a look at some other key demographic “movers” behind the 2016 Veterinary Spending increase.
Summary
With a high inflation rate, there is no doubt that higher income will always be a driver in this industry segment. However, we have seen many instances when a particular demographic group’s commitment to their Pets’ welfare overcomes financial pressures and they just spend the money. In 2015 it was the oldest consumers, the 75+ group. In 2016 it was the younger groups. Millennials and Gen Xers made the commitment to their Pet children and sharply increased their frequency of visits to Vet Clinics and the amount that they spent.
Because age is a major factor in this year’s lift in spending, you will see the impact across a variety of demographic measures. The younger crew is more likely to have a large number of households living in the central city, renting their homes, with 4+ people and all their kids being under 18. All these demographics showed a significant increase in Veterinary Spending in 2016.
The over $200K group again made a significant contribution to the increase but it was even more important that all the adults in the household worked. All wage and salary earners and 2 earner households both made a greater positive impact on Veterinary spending than even the highest income group.
On the downside, the over 65, retired group cut back on Veterinary spending as they moved to upgrade their food. It was not all down for the older Americans in 2016 as the 55>64 yrs old households staged a significant comeback after the big drop in 2015, which came as a result of their Food upgrade.
It becomes increasingly obvious that the spending in all the Pet Industry segments is interrelated. A major spending trend in any one segment can and does, affect the others. In 2016 the most important spending behavior trend in the Veterinary Segment was the younger groups’ demonstration of a significant increase in commitment to Veterinary Services. This bodes well for the future.


