2016 U.S. PET SUPPLIES SPENDING $15.84B…UP ↑$0.94B
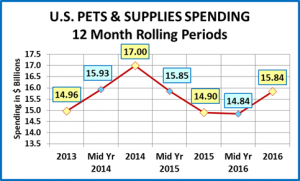
Driven by consumers value shopping for Pet Food, Total Pet Spending dropped by -$0.46B in 2016. Most of the $3B that consumers saved on food was applied to other segments, like Supplies, which recorded a $0.94B (+6.3%) increase to $15.84B. (Note: All numbers in this report come from or are calculated by using data from the US BLS Consumer Expenditure Surveys)
Although the increase only gets back about half of the $2.1B drop in Supplies Spending in 2015, it is certainly a turn in the right direction. We’ll “drill down” into the data to try to determine what and who are “behind” the beginning of this comeback for Supplies.
First, Supplies’ Spending per H/H in 2016 was $122.25, up 5.4% from $115.97 in 2015. (Note: A 2016 Pet H/H (65%) Spent $188.08) Slightly Increased H/H Spending is the main story in 2016. Other factors remain relatively unchanged. The $0.94B increase in spending came as a result of:
- 0.9% more H/H’s
- Spending 4.9% more $
- 0.5% more often
Let’s start with a visual overview. The chart below shows recent Supplies spending history.
You can’t discuss spending trends in the Supplies segment without talking about price – the CPI. Although many supplies are needed by Pet Parents, when they are bought and how much you spend is often discretionary. Many of the product categories in this segment have become commoditized so price is the main driver behind consumer purchasing behavior. When prices fall, consumers are more likely to buy more. When they go up, consumers spend less and/or buy less frequently. The big $2B drop in Supplies Spending in 2015 was driven by money. Many consumers upgraded their food, spending +$5.4B more. This gave them less to spend on other aspects of Pet Parenting. The Supply Segment suffered as consumers spent 4.1% less, but more importantly, they bought 10% less often. That seemingly small drop in purchase frequency (ex: Buy every 33 days instead of buying every 30 days) was the biggest reason behind the $2.1B drop in spending.
2014 was a deflationary year. As prices dropped, consumers bought more, +$2B more by year’s end. Then prices stabilized and began to move up in 2015. The consumers reacted immediately by spending less. Prices dropped like a rock in October to levels last seen in the spring of 2007. It undoubtedly helped, but was not enough to stave off the impact of the first 9 months of the year so spending fell -$2.1B in 2015.
In 2016 Prices initially stayed below 2015 levels. Spending stabilized and began to increase in the second half. Then prices jumped up in October and November. Although there was a big price drop in December, this autumn increase may have slightly reduced the overall gain for the year. By the way, prices in 2017 were down vs the same period in 2016, but they turned up sharply in July. We’ll see what happens.
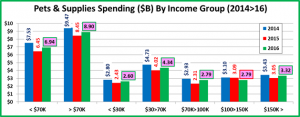
That gives us an overview of the situation. Now let’s look at the “who” behind the spending increase. First, by income level. The 2016 numbers in this chart and the one on Age Groups are highlighted to give you a better visual “read”.
- If outlined in green, sales were up in 2016
- If outlined in red, sales were down in 2016
- If highlighted in green, sales were up from 2014
- If highlighted in pink, sales were down from 2014
Observations: Although Spending is down from 2014 across the board, it did increase in 2016 for all but one group.
- $30K>$70K (45.9% of H/H’s)- $7.13B Up $0.8B (+12.6%). This lower middle income, value conscious group accounted for most of the drop in 2015. In 2016 they produced 80% of the spending increase.
- $100K>$150K (12.5% of H/H’s) – $2.79B Down -$0.3B (-9.7%). This group had the best performance in 2015 as their spending was “flat”. In 2016, they were the only group that spent less. This goes beyond Pet Supplies. They actually spent less on their total H/H expenditures. Yet another indication that value shopping is widespread.
- Higher Incomes – These groups are growing in H/H’s so in 2015 the US BLS began to define more groups – $150>199K and $200K>. This could be interesting. For example, in 2016 the combined $100>199K income group spent -$0.61B less on supplies while every income group above and below that level spent $1.55B more.
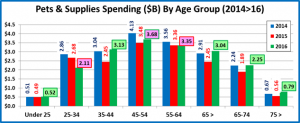
Now, we’ll look at spending by Age Group.
Observations: There is much more variation by Age Group. Spending for some groups is actually above the 2014 level.
- 45>54 (18.6% of H/H’s) $152.93 per H/H – $3.68B – Up $0.2B (+5.6%) This group has the highest income and overall expenditures and…spends the most on Pet Supplies. They spent less on food and their supplies’ spending rebounded, but not to 2014 levels. Fewer H/H’s (-0.8%) spent 3.7% more on supplies, 2.6% more often.
- 55>64 (19.0% of H/H’s) $135.96 per H/H – $3.35B – Down -$0.01B (-0.3%) This “Boomer” group spent $2.6B less on Food in 2016 but they didn’t use the savings to spend more on Supplies. Actually, 2.3% more H/H’s spent -2.7% less on Supplies, 0.3% more often. Without the increase in H/H’s, the drop would have been larger.
- 35>44 (16.6% of H/H’s) $146.01 per H/H – $3.13B – Up $0.68B (+28.1%) This group is second in income and overall expenditures. In 2016 these Gen Xers took over 2nd place in H/H spending on Pets & Supplies which bodes well for the future and makes them a prime marketing target. Their 2016 spending increase even put them 3% ahead of 2014. They got there by spending 26.4% more, 1.6% more often.
- 65> (24.1% of H/H’s) $97.42 per H/H – $1.89B – Up $0.59B (+24.3%) This group is growing rapidly. In 2016 they saved money on food and spent more on supplies. 4.2% more H/H’s spent 20.4% more, -0.9% less often.
- 25<34 (16.1% of H/H’s) $101.22per H/H – $2.68B – Down -$0.57B (-21.0%) In 2016, these older Millennials upgraded their Pet Food. They have strong price pressure – starting families and careers. They spent 18.0% less on Supplies and bought -3.0% less often.
- <25 (5.6% of H/H’s) $71.48 per H/H – $0.52B – Up $0.03B (+7.3%) This small group is getting smaller, down -3.9%. They spent 1.1% more on supplies, but importantly, 10.5% more often. They continue to acquire pets.
Finally, let’s take a look some other key demographic “movers” behind the 2016 Pet Supplies Spending increase.
Summary
The big drop in spending in 2015 was primarily driven by a 10% reduction in the frequency of purchase. In 2016, the frequency remained essentially unchanged. This puts a greater emphasis on the retail price at the time the buying decision is being made. The CPI remained down for much of 2016, turned up slightly in the fall, then fell sharply in the prime buying month of December. The CPI inflated ever so slightly, 0.1% for the year but the consumer still spent more. This could be a future model for increased spending on Supplies without the need for deflating prices, which puts strong margin pressure on manufacturers and retailers.
The increase in Supplies’ spending was not universal across all demographics. However, in some categories spending differences were less noticeable. Homeowners and Renters, as well as consumers with or without a college degree, showed positive numbers. There was also no decrease in spending by any racial or ethnic group.
The 35>44 year old Gen Xers showed a big increase and they were joined by the over 65 group, which also spent significantly more. We see these numbers reinforced by strong performances by married couples whose oldest child is between 6 and 17 and by retired and no earner households. Although it should be noted, that as a whole, all wage and salary earners spent more on Supplies. The only occupation with a decrease was the self-employed.
There were a couple of surprises. The Central City dwelling Consumers drove 98% of the increase while the Suburbs and Rural H/H’s were basically flat. Also, the $100>$199K income group had reduced supplies spending. In fact, their spending was down in all industry segments. This demonstrates that price matters to virtually everyone in the U.S.
The $0.94B increase in Supplies spending was obviously great news. How it happened is also very important. It occurred without pressure from overall deflated prices. It also came as a result of increased spending from a wide range of demographic groups. Both of these factors make the increased spending more likely to “stick” and the performance more “repeatable”. The CPI price pattern for 2017 so far looks very similar to 2016. We’ll see what happens.


