2015 U.S. PET SERVICES SPENDING $6.3B…UP ↑$0.6B
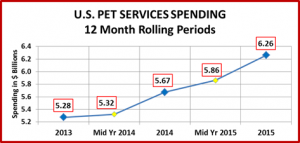
Although Non-Vet Pet Services is the smallest industry segment, it continues to grow and 2015 was another good year. Spending reached $6.26B, a 0.58B (10.2%) increase over 2014. (Note: All numbers in this report come from or are calculated by using data from the US BLS Consumer Expenditure Surveys)
Pet Services Spending per H/H in 2015 was $48.70, up from $44.68 in 2014. (Note: A 2015 Pet H/H (65%) Spent $74.92) More specifically, the increase in total spending came as a result of:
- 1.2% more H/H’s
- Spending 11.1% more $
- …1.9% less often
The chart below gives a visual overview of recent spending on Pet Services.
The increase has been consistent since 2013 with a definite spending “lift” in the second half of both years. Now we’ll start “drilling down” to look at spending by demographic categories. First, by Income…
Observations
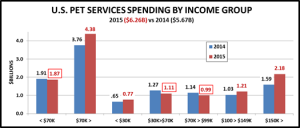
- <$70K; >$70K – Although it looks like the entire increase comes from the >$70K group, it is not that simple.
- $100K – This group is 21.5% of H/H’s and generated an increase of $0.78B – 132% of the total increase for the segment. If they were up this much, somebody had to be down…
- $30K to <$100K – They had a $0.31B (-13%) decrease in spending. This mid-income group is 46.5% of U.S. H/H’s and was responsible for 42% of the Services Spending in 2014. They can be very price sensitive and Services are often considered discretionary spending. The $30>$70K group also spent $1.7B more on Food.
- <$30K – It’s not all about $. This group (32% of H/H’s) had a $0.12B (18%) increase. This increase is not coming from the retired people in this group. It was generated by low income wage earners.
Now let’s look at spending by Age Group.
Observations
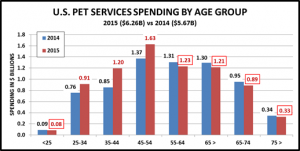
- 25>54 – (52.1% of H/H’s) – Service Spending is generally more discretionary in this group and they spent $0.75B more. They have the money to spend as they are the 1st, 2nd and 4th highest income groups. Also remember, the 25>45 group spent $1.7B less on Food.
- 55>74 – (32.3% of H/H’s) – As consumers age, Pet Services often become more of a “need”. However, they spent slightly less -$0.14B. These are primarily Baby Boomers and they just spent $6.1B more on Pet Food.
- <25 & >75 – (15.7% of H/H’s) Spending by these Age “Bookends” was basically flat. Each was down $0.01B.
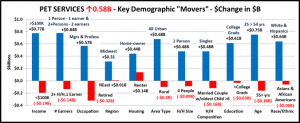
Take a look at some Key Demographic “Movers” then we’ll wrap it up.
Summary
Overall, the increase in Services Spending was about convenience, rather than physical need, as it was driven by the younger crowd – Gen X and the older Millennials. The Boomers spent so much in upgrading their Pet Food that a small decline was not unexpected. Income was also important in order to afford the rising service prices. Whether the household consists of 1 or 2+ members, all the adults worked. College educated, managers or professionals accounted for the vast majority of the increase. Retired people had a big decrease.
It really didn’t matter in what region of the country that you lived, as long as it was in a city or the suburbs. Homeowner ship also wasn’t a big factor as both homeowners and renters had increases. The spending increase by Hispanics was good news. Singles had the biggest growth while the “traditional” married couple with one earner and 2 children was almost certain to spend less. Basically, the increase was driven by busy “younger” (25>54) groups who needed help with Pet Parenting and could afford to pay for it.


