2015 U.S. PET FOOD SPENDING $29.5B…UP $5.4B
The U.S. Pet Industry had a good year in 2015. Spending reached $67.75B, up $3.43B (5.3%). However, as we have learned, the industry truly is a “sum” of its integral segments. Each segment has very specific and often very different buying behavior from the many consumer demographic groups. For this reason, we’re going to analyze each of the segments first. This will put the final analysis of Total Pet Spending into better perspective. Note: The numbers in this report come from or are calculated by using data from the current and past US BLS Consumer Expenditure Surveys. In 2015, this was gathered by the U.S. Census Bureau from over 40,000 interviews and spending diaries. The final data was then compiled and published by the US BLS.
We will begin with the largest Segment, Pet Food (and Treats). In 2015 Pet Food Spending reached $29.49B in the U.S. This is a $5.43B (22.5%) increase over 2014. Quite frankly, this is amazing. How amazing? In 2015 Pet Food accounted for 43.5% of the Pet Industry’s revenue. In 2014 it was only 37.4%. This is the highest level since 1998 – 44.9%. Something is definitely “happening” in this segment. Let’s see if we can determine what and who are behind this increase.
We’ll start at the household level. In any given week, 22,000,000 U.S. Households (1/6) buy Pet Food.
In 2015, the average U.S. Household (pet & non-pet) spent a total of $230.06 on Pet Food. This was a 21.1% increase over the $189.91 spent in 2014. However, this doesn’t “add up” to a 22.5% increase in total Food Spending. With additional data provided from the US BLS, here is what happened.
- 1.1% More U.S. households
- Spent 17.2% more $
- 3.4% more often
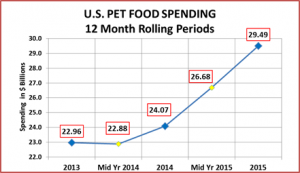
By the way, if 65% of U.S. H/H’s are pet parents then their annual Pet Food Spending is $353.94. Let’s look at the recent history of Pet Food Spending. This “rolling” chart provides a good overview.
Pet Food Spending dipped in the first half of 2014. This corresponds to the final days of a yearlong deflationary period in this segment. During deflation, in a “need” category like Food, you don’t buy more, you just spend less. When prices increased slightly in Mid-2014, Spending turned upward. However, stable or slightly increasing prices are not enough to explain the spectacular growth in 2015.
An initial clue is provided in the H/H spending numbers provided by the US BLS. The increase in H/H’s is pretty normal. The increased frequency of purchases seems relatively small but the increase in spending is huge. There is no getting around it. You also need to remember that these are national numbers. There was no huge gain in the number of Pets or Pet Owning Households, so these changes in frequency and spending numbers are likely to be the result of significant changes in the Pet Food purchasing behavior by specific demographic segments. First, let’s consider what might generate this radical increase in spending.
As an industry participant and observer for 27+ years and an adult consumer for 50 years, I can’t help but notice the “Pet” happenings around me – in the retail marketplace – in the media – in friend’s homes. Another venue to view what is happening in “Pet” is at an industry trade show – GPE & SuperZoo. The exhibitors and their product offerings generally reflect the current retail marketplace and in fact, can be harbingers of the future.
Between 2015 and 2014, the combined exhibitors at GPE & SuperZoo increased 5.9%. Here are some changes in the product category “numbers” during that time frame which are relevant to the Food Segment:
- The total number of exhibitors in the “Natural” Section increased 30.7%. This parallels the strong “Natural” trend in the overall U.S. consumer market.
- Exhibitors selling dog and/or cat treats were the most numerous category at all the shows – 1 in every 4 booths – and there were 9.1% more in 2015.
- The number of Food booths was up only slightly 0.5%.
- However, 16% of First Time Exhibitors were selling dog and/or cat food or treats.
- Meds/Supplements – The Exhibitor count was up 16.8% and this continues to be the fastest growing product category. Remember, many of these items are sold in the form of “easy to dose” treats.
It appears that the increase in H/H spending on Pet Food came mainly as a result of:
- Pet Parents upgrading their Pet Food: SuperPremium, Natural, raw, organic…all have distinct nutritional benefits for our companion animals…and they all cost more.
- Buying more and higher quality treats. Although treats have always been popular, much of this behavior can be traced to the radical increase in the Meds/Supplement category. This has been driven by strong inflation in the Veterinary Segment. Since many of these supplements are produced in treat form, this would increase Pet Food spending.
The “What” behind the spending increase would seem to require
- an educated group to fully appreciate the benefits of the upgraded or medicinal products…
- with enough extra money to spend…
- or an unwavering “spend whatever is needed” attitude towards their Pet “children.”
Let’s look at some Food Spending Demographics to see if we can locate the “Who” behind the big increase.
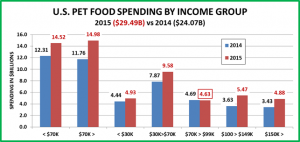
First, here is the Pet Food Spending by Income Group.
Observations
Actually, there was an increase in per H/H Food spending in every income group. The only Total Food spending decrease came as a result of reduced number of H/H’s in the $70>$99K group.
- Under $30K (32.0% of H/H’s) – $120.30 per H/H – $4.93B – Up $0.49B (+11.0%). Significant shares of this group are <25, >75, Retired or African American. The group is -3.3% smaller in size, so some are definitely spending much more on Food.
- $30K>$70K (32.4% of H/H’s) – $228.34 per H/H – $9.58B – Up $1.71B (+21.7%). Income triples. Expenditures increase 63%. Home ownership doubles. A more diverse group which closely matches the national average.
- $70K>$99K (14.1% of H/H’s) – $257.97 per H/H – $4.63B – Down $60M (-1.3%). This group is near the top of the “middle income”. They had a small 4.8% increase in H/H spending but the number of H/H’s fell by 5+%.
- >$100K (21.5% of H/H’s) – $379.50 per H/H – $10.35B – Up $3.29B (+46.6%). Obviously, income does matter in this situation as 21.5% of U.S. H/H’s generated 60% of the $5.4B increase.
While income is a major factor in the increase, it is not the only one. The $30>$70K group also had a strong year. Also note: For the first time, the >$70K group accounted for more than 50% of total Food Spending (50.8%).
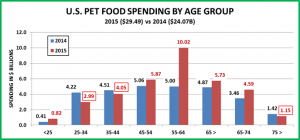
Now let’s take a look at another Key Demographic Category – Age
Observations
There is obviously a lot more disparity in the spending by age groups than in the income groups.
- 55>64 (18.8% of H/H’s) – $409.47 per H/H – $10.02B – Up $5.02B (+100.5%). This group is perhaps the key to the huge increase in Food Spending. They are 100% Baby Boomers. Their income is well above the mean but not in the highest tier. 1.3% of their total spending is on their pets. They have small H/H’s – 2.2 people. 76% own their own home – 35% w/o mortgage. Drilling deeper, here is where the increase comes from:
- 4.6% More households
- Who Spent 65.8% more $
- 15.6% more often
- 65>74 (13.5% of H/H’s) – $276.18 per H/H – $4.59B – Up $1.13B (+32.7%). – A big increase. Much of this group is retired. Their income is reduced but they still spend a lot on their pets – 1.24% of total expenditures. They have only 1.8 people per H/H. 80% are homeowners – 51% w/no mtge. – A Growing number of Baby Boomers
- 75> (9.8% of H/H’s) – $91.75 per H/H – $1.15B – Down -$0.27B (-19.0%). Both the effort and the expense of Pet Parenting become issues as we reach 75+. As a result, pet ownership begins to decline. This was a sharp drop. The huge “Boomer” group will start turning 75 in 2021. We should be looking for solutions.
- 45>54 (18.9% of H/H’s) – $250.49 per H/H – $5.87B – Up $0.81B (+16.2%) This group has the highest income and the most in Total H/H expenditures. Last year they were #1 in Pet Food spending. Their H/H spending went up about 17% but they fell to number 2 in Total Food $…by $4B. – The percentage of Baby Boomers is declining.
- 35<44 (16.8% of H/H’s) – $192.48 per H/H – $4.05B – Down -$0.45B (-10.1%) They are second in income and expenditures. However, they have the biggest families – averaging 1.4 children under 18 per H/H. Both their H/H spending and number of households declined slightly in 2015 resulting in the $0.45B drop total Food $.
- 25>34 (16.4% of H/H’s) – $137.01 per H/H – $2.99B – Down -$1.23B (-29.2%) Their income is growing but so is spending – acquiring their first home (39%), starting a family – an average of 1 child per H/H. With over 91% of their after tax income committed, they have financial pressures. In the second half of 2014 this group had a huge increase in Food Spending. With their “Millennial view” of “natural,” they likely “opted in” early for “upgraded” pet foods. In the second half of 2015 financial pressures and bargain prices on “regular” food may have convinced them to “cut back” to more normal fare.
- <25 (5.9% of H/H’s) – $99.17 per H/H – $0.82B – Up $0.42B (+99.2%) These youngest Millennials are getting started as Pet Parents. It looks like they are acquiring pets and choosing the “high quality” food segment.
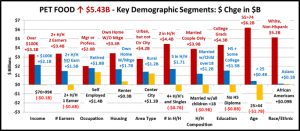
The chart below has some other key demographic “movers” in 2015 Pet Food Spending. Take a look! These should help to paint a much clearer picture of the “who” behind the $5.4B increase.
Summary
There is no doubt that older Americans drove this big increase, especially 55>74 year olds. They are married couples alone or with one child over 18 still at home. They live in a suburban environment in their own home, which they just paid off. Either both of them work as managers, professionals or in their own business….or no one works…the joy of retirement. It is really the same educated group, just in 2 different life stages.
On the flip side, the drop in spending affects 1/3 of U.S. Households. Much of the decline is coming from what used to be considered the “traditional” American Family – A Married Couple, 25 to 44 years of age. Only one of them works because the other needs to stay home to take care of their 2 young kids. This makes spending pretty tight so they always look for a good price.
While the “journey” has been complicated, the conclusion seems to be rather simple. The big increase in Food Spending was driven by the “Baby Boomers.” They upgraded the quality of their Pet Food and treats and began using the new medicinal supplements available in Treat form. Note: They have been the leaders in Veterinary Spending so they would recognize the “value” in these decisions. This still leaves us with an unanswered question…
How much will the huge increase in food spending affect the spending in other segments?




Interesting article. When you refer to “pet food,” however, are you meaning dog & cat food only?
Dear Jenny,
Excuse me. I missed this question. Pet Food refers to food for all pets, not just dogs and cats.
John