Pet Spending Update: Up ↑$3B – Vet and Supplies lead the way!
As you may recall from a Post that I did last Fall, Pet now has its own listing in the Consumer Expenditure Survey conducted by the U.S. Bureau of Labor and Statistics.
Recently, they published a mid-year update. This is a “rolling” report covering the 12 months ending June 2014. The full year for 2014 will be published in September, which will give us the first opportunity for a direct year to year comparison. However, this update also covers 12 mos and shows us the market direction.
In conversations with the personnel who conduct the survey I found out that there is more detailed data which is not published but available if you know what to ask for and who to ask. So here’s what I got:
Total Pet expenditures per household (published) plus 4 subsets:
• Pet Food
• Pets & Supplies
• Non-Vet Pet Services
• Veterinary Services
They provided details for income groupings of $5-20K each from less than $5K to over $150K so the data can be broken in a huge variety of groups.
Their data is only published in terms of expenditures per household – Pet & NonPet together. They also don’t generate total Retail $. Getting these Retail totals is more complex. You must consider how the information was gathered – by quarterly interview or weekly diary. With this knowledge, I developed a formula to turn their annual expenditure numbers into Total Retail $ per category for each product and income segment.
The specifics for Consumer Pet Spending for the 12 months ending June 2014 are in the table below. WARNING: This is going to get somewhat complex. We’ll try to simplify it somewhat with some basic graphs and charts and some “smoking gun” observations. At the end we will provide you with additional detailed data including:
• 2013 Annual numbers
• Actual difference between midyear 2014 and 2013
• % difference between midyear 2014 and 2013
You can then make your own comparisons in the specific areas that are of interest to your business.
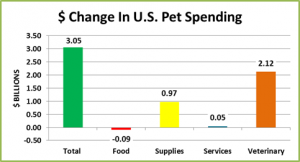
Right now, Consumer expenditures on Pet are $60.8B – up $3.05B! Let’s see where it comes from!
Here are the overall numbers and the change between Midyear 2014 and the 2013 Full year report.
The difference in the percentages between Households and the total market is due to the increase in the number of households. For this analysis we will focus on the spending in the total market and more specifically the changes. Here’s where the $3.05B comes from in terms of category.
Observations
- Huge growth in Veterinary – ↑$2.12B – Even more than simple price inflation would explain.
- Food is falling slightly. ↓$86M to be “exact”. There was strong price deflation in food from Nov 2013 to Mar 2014. Remember, Food is a need based purchase. You don’t buy more because prices are down. You just spend less.
- Pets, Supplies and Medications strongly up. ↑$970M. This is a bit more complicated. Like food, supplies have also had deflationary pressure. However, much of the supply segment is “discretionary” spending. When prices are down, you are likely to buy more. The USBLS also includes Prescription Pet Medications in this segment. Prescription prices for Pets and People have been sharply rising.
- Pet Services are up slightly ↑$50M but at 0.9% their $ growth is essentially flat. In fact, with the inflation in this segment the amount of services is actually down.
- In the total Pet Market, the growth comes from Veterinary Services and Supplies.
Income matters.<$70K /$70K> has been the breakpoint for 50% of Pet Spending. Here are the numbers:
Once again, let’s focus on the $ change…for each income segment.
Here’s what it looks like side by side on a graph:
Observations
- Veterinary Sales is still the big driver. Although 90% is coming from the over %70K households!
- Food is falling slightly in both income segments. The drop is close to equal. Of note: The under $70K has maintained the exact same share of total food sales at 51.3%
- Pet Supplies shows a big change from the overall market. The over $70K group is up over $1B while the under $70K is actually down about $60M. Apparently the reduced supply prices aren’t driving increased purchases in the lower income group.
- Pet Services are basically flat in $ for both segments. Considering inflation, the amount of services is definitely slightly down for the under $70K group.
- Total Pet – 94% of the increase is coming from the over $70K.The under $70K group is now 68% of U.S. households up slightly from 67.8% in 2013. Their share of the total pet business has fallen from 48.1% to 46.0% in just 6 months.
This huge difference in performance suggests a deeper analysis. Let’s look at some details in the under $70K group:
- Food – The under $30K group actually spent $200M more. The big drop is coming in $50>$70K.
- Supplies – The $60M decrease is totally due to a $120M drop in spending by the $50>$70K group.
- Services – In this case the $30K>$40K segment has a $80M increase. Above and below are down.
- Veterinary – The $50K>$70K are spending their $ here – up $1.4B. Under $50K is DOWN $1.14B.
- Total Pet – The $1.B increase in Vet Spending is fueling the entire increase in the under $70K group.
Since 94+% of all the growth is coming from households with income above $70K. We definitely need to take a closer look at the spending at higher income levels.
In reviewing the detailed data, one fact can’t be ignored 109.2% of the overall $3.05B increase came from households with income above $120K. 12.9% of U.S. households are driving the increase in Pet Spending. Let’s follow the money and set up a new income division Over/Under $120K.
Pet Spending in <$120K/>$120K H/H’s Here are the numbers.
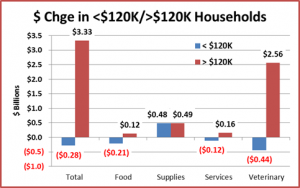
Next…the $ change…for each of this new division’s income segments.
Here’s what they look like side by side on a graph:
Observations
- Veterinary Sales is an even bigger driver. The households under $120K are spending $440M less.
- Food finally looks up. +$120M in the over $120K group. They actually spent less money per household on Food but a significant increase in the number of households over $150K generated this gain.
- Pet Supplies – The $970M gain is evenly divided between the over/under $120K groups.
- Pet Services – Like Veterinary and Food, the entire increase was “funded” by the over $120K group.
- Total Pet – 109.2% of the increase is coming from the over $120K group. The spending from 116M households (87.1%) is down $280M.
Overall Commentary
- Veterinary – $2B – 69.5% of the total increase comes from Veterinary Services. The $120K, high income group, is spending whatever is necessary, regardless of the cost. In fact, they account for 35.3% of all Veterinary expenditures. Most other groups are spending less. Of special concern is the under $50K segment. Their spending is down over $1B – in spite of and perhaps because of continuing high price increases. The result is a big reduction in veterinary visits.
- Food is down $85M primarily to deflation from November 2013 through March 2014. It is significant that the under $70K group maintained its 51.3% share of Pet Food spending. This indicates that Pets are still a major part of households across all income levels. As in supplies, deflation causes extreme competitive pressure for the manufacturers. However, unlike Supplies, lower prices do not generate increased purchases. Let’s hope the Pet Food CPI begins a gradual increase.
- Pet Supplies – The ongoing low prices are undoubtedly helping to push sales. The $1B increase is specifically being driven by 2 income groups – $70K>$120K and $150K>. More after tax income helps spur increased discretionary purchases. The problem comes for the manufacturers in trying to profitably maintain competitive pricing so they don’t lose their overall appeal across all the income groups. The current increase in spending by the higher income groups also indicates that there is an ongoing and future market for high end products.
- Pet Service prices primarily appeal to higher income households. In fact 63.6% of purchases come from 32.1% of households – those over $70K in income. 35.6% of purchases are from the 12.9% of households with an income over $120K. With a 3+% inflation rate and a 0.9% increase in sales, the amount of services is actually down from 2013
- Pet is now 0.93% of all consumer spending – up from 0.9%. It is near 0.9% for most income groups. However, 109.2% of the overall increase comes from the over $120K group. 71% of the increase comes from households with an income of $150K or more – the only income group with increases in spending in all segments. 7.9% of households now generate 18.3% of all Pet Spending. Considering these high income facts, one has to wonder if the growth in the industry is moving from “upscale” households to “elite” households.
Thanks for your patience in “wading” through this complex subject!
As promised, a 2 page detailed Appendix is available through the link below. Just click on the button to download and save the file as a PDF.
[button link=”https://petbusinessprofessor.com/wp-content/uploads/2015/05/Pet-Spending-Details-May-15.pdf” type=”icon” newwindow=”yes”] Download Data (PDF)[/button]


