GLOBAL PET EXPO 2025…PETS. – Where perspectives spark innovation!
Global Pet Expo, the Pet Industry’s premiere event, continues at its “new normal”. The exhibitor count is currently 1077. It could reach 1139 by showtime. This is more than 1129 in 24 but lower than the 1173 peak in 2019. However, it is still more than enough.
Live events are critical in the Pet Industry because of our attitude towards Pets and Pet Products. Pets are an integral part of our families, and we now increasingly personify them. Pet shows are primarily focused on Pet Products. Studies have shown that over 60% of consumers prefer to make initial buying decisions on Pet Products in person. This makes Pet Products 2nd only to fresh groceries in this behavior. This preference applies to all Pet Products buyers, not just consumers. The retailers and distributors attending GPE and SuperZoo want to see and touch a new product before they buy. Live shows are not just important, they are critical to the continued growth and strength of the Pet Industry.
Inflation has slowed but it is cumulative. You will again see evidence of its impact in the makeup of exhibitors at GPE 2025. Consumers are looking for Value (Quality + Price). One way to get it is through Private Label products. GPE 25 has over 120 companies actively soliciting OEM customers. Foreign companies are especially capable of OEM, so their booth share from 40 countries is now 37%. (up from 36% in 24) Back in 2019, it was 25%. These trends have also affected individual product categories. Now, let’s take a brief look at what awaits attendees of GPE 2025.
If all 62 open booths are filled, the exhibitor count will be -2.7% lower than the 2019 peak but the booth square footage will be +0.8% more. Regardless of the final number, there will be more than enough exhibitors to satisfy the needs and wants of every buyer. Here are some relevant facts.
- 1077 Booths – assigned as of 2/17 but, with commitments the final count could reach 1139
- 357,000 sq ft of exhibit booth space (Not counting the 45,000 sq ft new product area)
- 10 x 20 is the most popular size – 361 (33.5% of committed exhibitors), but 10 x 10 is a close 2nd with 355.
- Booths are bigger – the average size is 318 sq ft, +5% from 2024. Exhibitors want more space.
- Size matters – Booths 300 to 800 sq ft (26%) occupy 41% of the space. Those with 1000+ sq ft (5%) cover 28%.
Will you see any new exhibitors or is it the usual group? There have been 10 live pet trade shows from 2019>24 – 5 GPEs and 5 SZs. There are currently 1077 exhibitors at GPE 25 but It took 3870 companies to fill all 11 shows. Of the GPE 25 exhibitors:
- 139 (13%) – Did all 10 other shows
- 678 (63%) – Did GPE 2024
- 321 (30%) – Are new to GPE (at least from 2019>24)
- 257 (24%) – Did NO other shows from 2019>2024
The percentage of exhibitors new to GPE this year is slightly above “normal”. There is definitely plenty of “New” to see.
Special “Floor Sections” at GPE account for 54% of Booths, up from 37.2% in 2019. This was due to the addition of the Supplier Pavilion in 2024 and the China Pavilion in 2025. The primary comparison of GPE 25 to previous years in this and other areas will be by share of booths.
Note: In all charts, the Booth count comparison is as of 2/17/25 vs 2/16/24. In the share portion, the 2019>2024 data is the final number while the 2025 data reflects the status as of 2/17/25.
- Natural – 186 Booths. The number of booths is down from 201 in 24 and the share has been falling since 2022. It is still important as it is a strong trend in society. A new subsection of Sustainability was added this year.
- Modern Pet – 17 Booths. The booth share continues to fall, down 72% from 2019. This Boutique section is essentially the opposite of Natural and more discretionary in a country that is increasingly focused on “needs”.
- Aquatic – 25 Booths. This category had strong 24>25 growth but the booth share is still down 56% from 2019.
- 1st Time Exhibitors – 114 Booths. Their share rebounded in 2025 but most of the 321 exhibitors who didn’t exhibit at GPE (at least from 2019>2024) chose the regular floor or another special section. GPE is a “must do” for new companies and New – products and companies are a major focus of GPE. A Startup subsection was added this year.
- Supplier – 47 Booths. This section was added in 2024 in response to the growing popularity of OEM products. This trend is still going strong.
- International/Country Pavvilions – The foreign surge continues and grows. 37% of GPE exhibitors are from 40 foreign countries. The most visible impact is the new China pavilion with 220 booths. Note: All are reserved but 34 are still unassigned.
There are large numbers of exhibitors in the “regular” floor space who would qualify for inclusion in these sections. You need to “work” the whole show to ensure that you get a full view of the product categories of interest to you. I will again be creating a GPE Exhibitor Visit Planner that allows attendees to plan their floor time by targeting the exhibitors with products of interest. The GPE 2025 SuperSearch will be made available by March 10th and be regularly updated with last minute changes. Now, let’s take a look at the results from this year’s research on exhibitors’ product offerings.
1st, we’ll Compare Exhibitor Types– By function: By Animal type (Remember, the 2025 numbers are as of 2/17/25)
Results were mostly negative as only 4 categories have currently gained share from the 2024 final.
- Dogs Still Rule – They are still 83>84% of all booths. 5 out of every 6 booths are selling dog products.
- Cats had the biggest gain of any animal and are now offered by 61.8% of exhibitors. Up from 40% back in 2014.
- Fish/Aquatic – This category continues to lose share and is down 55% from 2017.
- Other Animals – Small Animals lost some ground. All others gained share. The biggest lift was in Birds, +0.9%.
- Business Services – High prices continue to drive the popularity of private label/OEM products. They lost a little share but it is still triple 2019. This reflects the changes in the industry. BTW, there were 8 exhibitors in 2014.
- Distributors – Their share fell and is again below 1%. The supply chain is shortening for many categories.
- Gift/Gen Mdse – Their share has been generally declining since peaking at 7.8% in 2016.
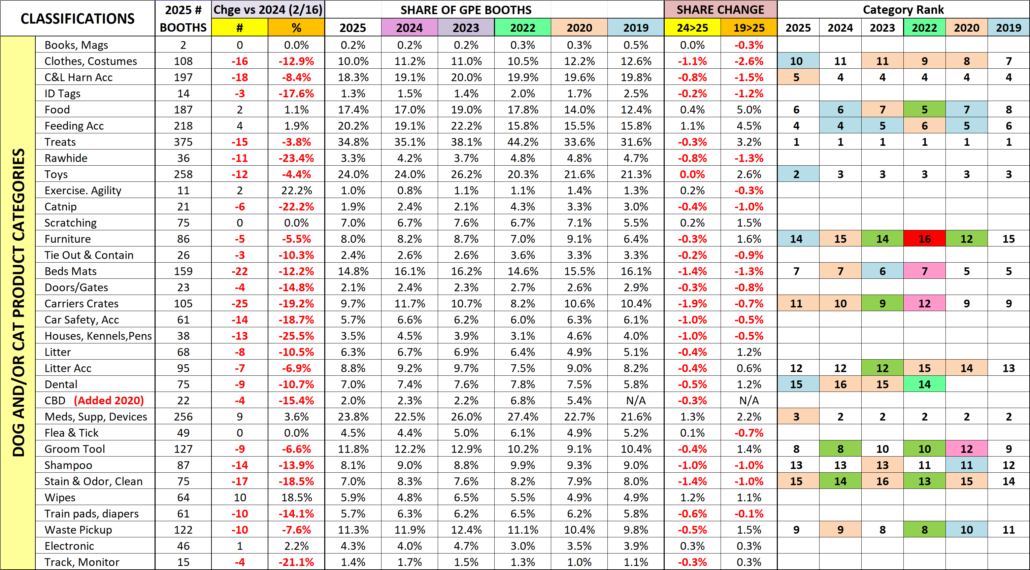
Dogs and Cats are still the undisputed royalty of Pet. Because of their huge impact on the industry, I have divided the products designed for them into 33 subcategories. Let’s see how this year’s GPE Top Ten (by booth count) are doing. Note: The 2025 ranks are as of 2/17/25. The 2019>2024 ranks are based upon the final numbers.
Only 3 have more booths than 2/16/24, but the ranking changed for 4 – 2 up & 2 down. Clothes/Costumes made the list despite losing -1.1% in share. Food related categories is the big driver. They have the only increases in booth count vs 2024. The biggest share gain was by Meds/Supplements, while Beds had the biggest loss.
- Treats are still #1 although their share fell by -0.3%. Their priority is reflected in their frequency – 1 in 3 booths offers treats. Many supplements are in treat form and have helped maintain treats at the top.
- Toys – Toys’ share was stable but they moved up to #2 from #3. This is directly tied to the continuing surge in Chinese companies. 1 in 5 exhibitors are now based in China.
- OTC Meds/Supplements/Devices – A 3.6% gain in booths and a 1.3% gain in share. Both are the biggest lifts, but they fell from #2 to #3. This anomally was due to a rank change that happened from 2/16/24 to showtime for GPE 2024. They are down 3.6% in share from their peak in 2022, but up 12.8% from 2014 (+116%)
- Feeding Accessories. They held on to #4. Their booth count and share both rose. Food is the top priority of Pet Parents so bowls/feeders are a necessity. More foreign exhibitors has helped.
- Collars, Leads & Harnesses – They fell from a tie for #4 to #5. Their share has been relatively stable since 2019 after falling from 22.1% in 2018. In 2016, they also had a 22.1% share which earned them the #2 ranking.
- Food is a priority as Pet Parents focus on nutrition, health and wellness. Except for some treats, almost all Pet Food sold in the USA is made in the USA. However, frequent purchasing and near record retail prices make it a prime candidate for OEM.
- Beds/Mats – They had the biggest share loss but stayed #7. They also benefit from more OEM.
- Grooming Tools – They lost a little share from the record levels of 2023 & 2024, but stayed #8. Once again, Chinese companies are a primary source for this product category.
- Waste Pickup – They also lost a little share but held on to the #9 spot.
- Clothes/Costumes – They lost -1.1% in share but Carriers/Crates lost -2.0% so they swapped places – #11 for #10. They are now in the Top 10 for the 1st time since 2022. Both of these strong selling categories are often made for private label.
Pet Parents’ concern for the overall health and wellness of their “pet children” remains a big priority but the impact of strong cumulative Petflation has pushed the “value” of Private Label products to the forefront. Their OEM capabilities plus the end of travel restrictions has caused a recent surge in foreign exhibitors, including the huge new China pavilion. They will occupy over 400 booths (37%). In pre-pandemic 2019 they had 295 booths (25%). You first see the impact at the animal type level. In OEM, Dog & Cat are where the $ are. Dogs are #1 (5 of 6 booths) and Cats continue to gain share, now at a record 61.8% (3 of 5 booths). Some product categories are also gaining or keeping an elevated share including Toys, Bowls/Feeders, Grooming Tools, Collars & Leads, Beds and Waste Disposal products.
The last chart details the specifics for all 33 of the Dog/Cat product categories that I defined. Of note: All the data inputs for this report and the SuperSearch tool come from a review of the GPE online exhibitor product listings AND visits to over 1400 websites. They’re not 100% accurate, but pretty close. Which categories are of interest to your business?
GPE 2025 is about innovation and fulfilling needs. There are products, services and education to fulfill every need and…want. There is also an abundance of “new” – both in products and the 250+ exhibitors who are new to Pet Industry shows. However, to reap the benefits, you need a plan. Exhibitors must showcase the “right” items. Attendees need to strategically analyze their data, determine what they need to improve their business and develop a plan to find the products to fulfill their needs. Then…execute the plan. If they do nothing else at GPE, attendees will have 1 minute and 9 seconds to spend at each booth. You definitely need a plan! The GPE 2025 SuperSearch will be available the week of March 10th. It can help. Try it out. Good luck in Orlando!


