2023 Veterinary Spending was $35.66B – Where did it come from…?
Now we will turn to Veterinary Services. For years, Veterinary Services have had high inflation. This has resulted in CU income becoming the dominant factor in spending and a reduction in visit frequency.
In 2017 low inflation drove a 7.2% increase in visit frequency and a $2.5B spending lift. In 2018 inflation returned to normal. Consumers spent $0.56B more (+2.7%), but inflation was 2.6% so almost all of the lift was from higher prices. In 2019 the situation got worse. Consumers spent $0.58B (+2.7%) more but inflation was 4.1% so there was a decrease in the amount Vet Services purchased. In 2020 the pandemic hit, and Pet Parents focused on needs – Food & Veterinary. Veterinary spending grew $3.05B, (+14.0%). In 2021, this behavior grew even stronger and produced a record $7.82B (+31.5%) increase. In 2022 inflation reached 8.8%. Spending fell -$2.95B (-9.0%) but the amount of Vet Services sold fell 16.4%. In 2023 inflation was 9.4% but Vet Care is needed so spending grew $5.95B (+20.0%) – with inflation, +9.7%.
We’ll start our analysis with the groups who were responsible for the bulk of Veterinary spending in 2023 and the $5.95B increase. The first chart details the biggest Veterinary spenders for each of 10 demographic categories. It shows their share of CU’s, share of Veterinary spending and their spending performance (Share of spending/share of CU’s). In terms of performance – 5 groups perform above 120%, the same as 2022, but 1 less than 2018>2021. This is 1 less than Supplies, 2 less than Services (7) but 2 more than Food (3). This means that these big spenders are performing well but it also signals that there is still disparity between the best and worst performing demographics in this “needed” segment. Only the Age & Income groups are different from Total Pet and the categories are listed in the order that reflects their share of Total Pet $pending. Again, High Income is the most important factor in Spending.
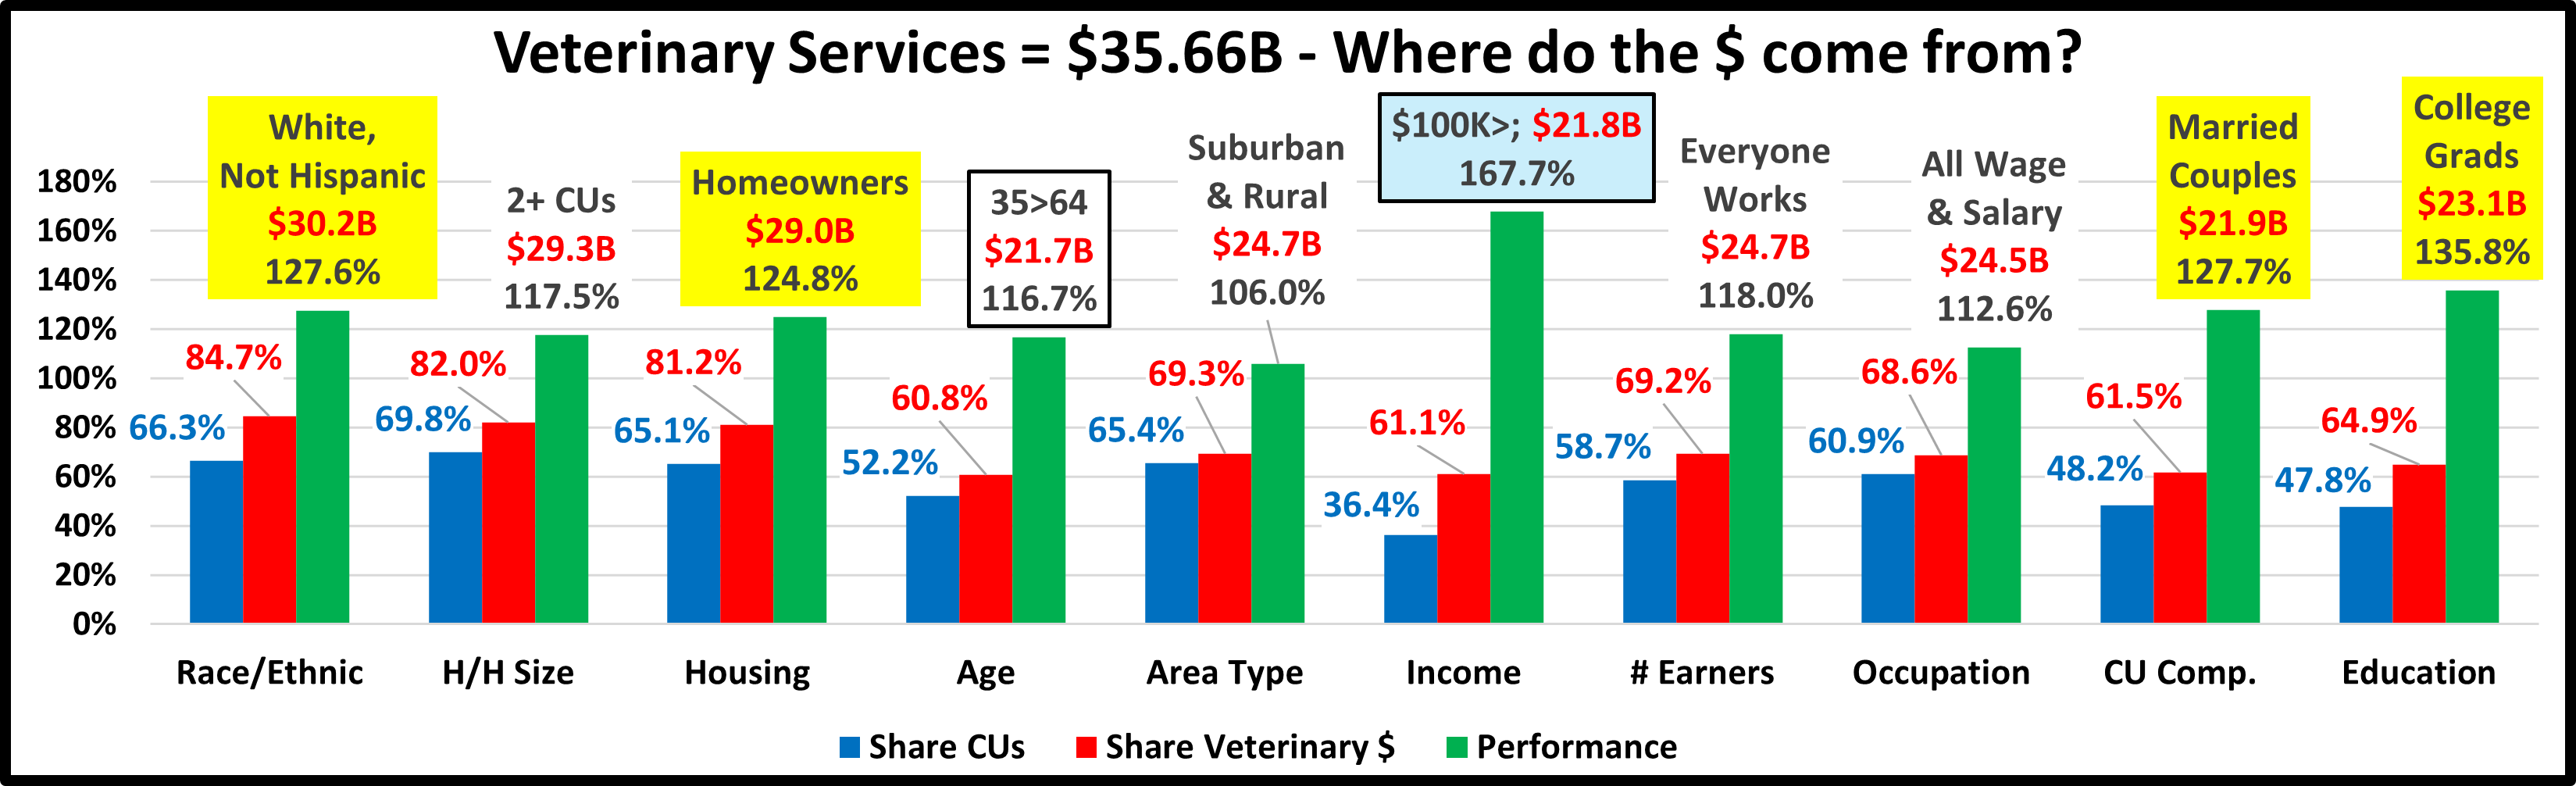
- Race/Ethnic – White, not Hispanic (84.7%) down from 86.0%. This group accounts for the vast majority of spending in every segment but lost share in Vet $ in 2023. Their 127.6% performance is also down from 128.0% but they grew from #5 to #4 in importance in Veterinary Spending. Only African Americans spent less, -$0.04B (-3.8%). Whites spent $4.64B (+18.2%) more but their share & performance fell because of a $1.24B (58.7%) lift by Hispanics.
- # in CU – 2+ people (82.0%) up from 79.8% This group, which is 69.8% of U.S. CUs, gained in share and their performance grew from 115.7% to 117.5%. Their rank in importance in Vet Spending moved from #8 to #7. All but 4 People spent more. The gains happened because Singles had a much smaller lift (+7.0%) than 2+ CUs (+23.3%).
- Housing – Homeowners (81.2%) down from 83.9% Homeownership is a major factor in pet ownership and spending in all industry segments. In terms of importance to Veterinary spending, their 124.8% performance rating is down from 128.9%, and they dropped to 5th from 4th place. All segments increased spending. Renters were +39.7% while Homeowners were +16.2%. This produced the drops in share & performance for Homeowners. We should also note that Homeownership is definitely not as important to Veterinary Spending as it once was. In 2015 their share was 88.4% with performance of 141.8%.
- Age – 35>64 (60.8%) down from 61.1% Their performance also fell from 117.1% to 116.7% and they fell to 8th from 6th place in importance. All ages spent more but 45>54 was only +0.2% while <25 was +190.1%. These were big factors in the group’s small drops in share and performance.
- Area – Suburban & Rural (69.3%) down from 70.9% Suburban CU’s are the biggest spenders in every segment. All areas spent more. Center City had the biggest % increase, +27.2%, while Rural was only up +6.0%. This drove the drop in share and caused their performance to fall to 106.0%, from 108.2%. They’re still last in importance.
- Income – Over $100K (61.1%) up from 57.0% Their performance also grew from 160.8% to 167.7%. Higher income is still the most important factor in Veterinary spending. The only drops were from <$30K, -$1.11B and $50>69K, -$0.10B. The $100K> groups spent $4.85B more. This caused he big lifts in share and performance.
- # Earners – “Everyone Works” (69.2%) up from 67.7% Their Performance also grew from 116.1% to 118.0%. They moved up from #7 to #6 in importance. Only No Earner, Singles spent less. 3+ Earners were only +$0.05B but 2 Earners & 1 Earner, Singles spent $4.56B more. They drove the group’s lifts.
- Occupation – All Wage & Salaried (68.6%) up from 65.9% and their performance increased from 109.3% to 112.6%. In the group, only Blue Collar spent less. Outside the group, Self-employed & A/O, Unemployed spent less. White Collar workers spent $5.32B, +35.6% more. They drove the lifts in share in performance. We should also note that their perfomance lift was slowed a little because they had 1.1 million more CUs than in 2022.
- CU Composition – Married Couples (61.5%) down from 62.5% Their performance also fell to 127.7% from 130.8% and they moved down to #3 from #2 in importance. Only Married, Oldest Child 18> & Single Parents spent less. The drops in share and performance were due to big lifts by Singles & Unmarried, All Adult CUs.
- Education – College Grads (64.9%) up from 60.9%. Income generally increases with education. It is also important in understanding the need for regular Veterinary care. Their performance also increased from 130.3% to 135.8% and they moved up from #3 to #2 in importance. Only HS Grads or less spent less in 2023. College grads (47.8% of CUs) generated 84.7% of the 22>23 lift and 100% of the big increases in share and performance.
Spending disparity rose in 5 categories and fell in 5 categories. The average group performance was 125.4%, up from 123.2% in 2022 so spending became slightly less balanced. Notably, higher income & education became a little more important. In fact, a College Degree rose to #2 in importance.
Now, we’ll look at 2023’s best and worst performing Veterinary spending segments in each category.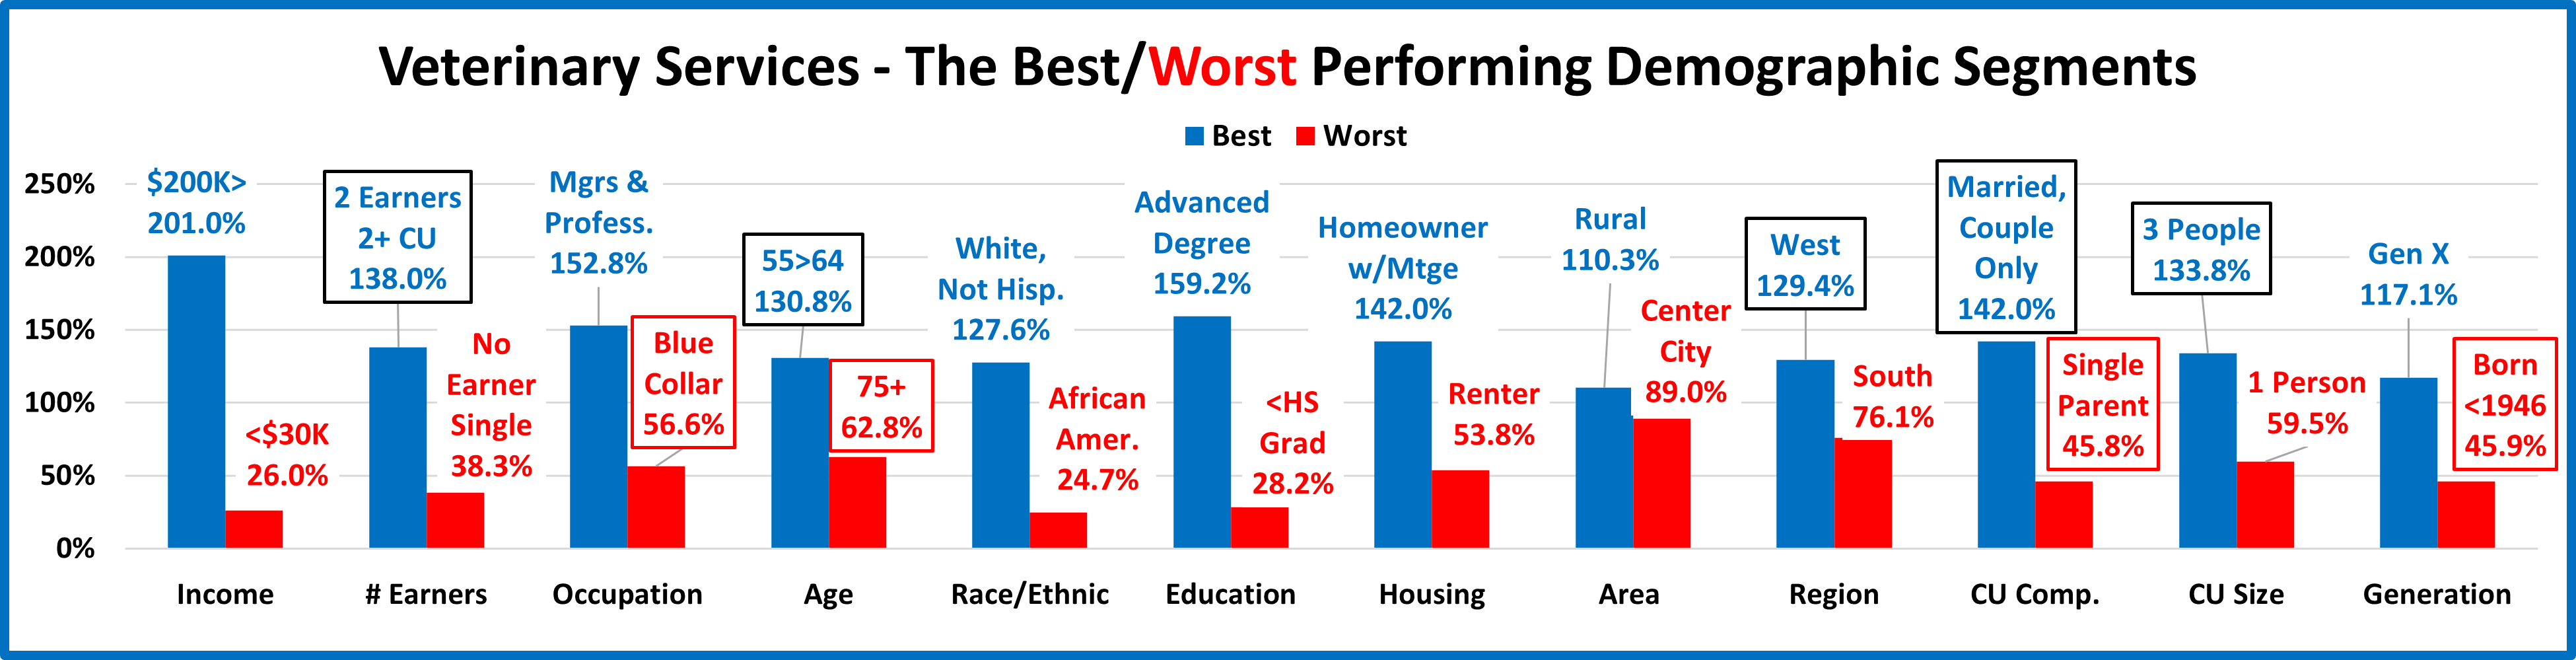
There are no surprising winners or losers but 9 are different from 2022, up from 4 last year. This is 5 more than Services, and 1 more than Supplies but 2 less than the 11 in Food. Also, the average difference between Best & Worst was 89.8%, a little more than 88.8% in 2022. There was considerable turmoil, but it was evenly divided so the change in spending disparity between segments in 2023 was minimal. The changes from 2022 are “boxed”. We should note:
- Income– The Winner & Loser are the same. The gap is 175.0% but 6.8% less than 2022.
- Earners – 2 Earners replaced 3+ Earners on top but the gap widened by 3.8%.
- Occupation – Blue Collar replaced Service Workers at the bottom and the gap widened a lot, +32.3%.
- Age – 55>64 replaced 45>54 yr-olds and 75+ replaced <25. The gap actually narrowed by an incredible -42.0%.
- Race/Ethnic; Another set of expected repeats. The gap between winner and loser widened by 6.2%
- Education; Housing; Area – These all had an expected repeat winner & loser, but the performance gap change for Education was very different. Education: +33.3%; Housing: -15.0%; Area: -19.2%.
- Region – West replaced Midwest at the top. The South has now finished last for 8 years in a row, but the win/lose gap increased by 12.2%. Also, 3 regions performed at 100+%. That hasn’t happened since 2018.
- CU Composition – Couple Only replaced Child 18> & Single Parents replaced Child <6. The gap widened +14.8%.
- # in CU – 3 People replaced 4 on top and the gap grew by +5.3%. Only 2 & 3 people CUs perform above 100%.
- Generation – Born <1946 replaced Gen Z at the bottom and the performance gap narrowed by -13.4%.
It’s time to “Show you the money”. Here are segments with the biggest $ changes in Veterinary Spending.
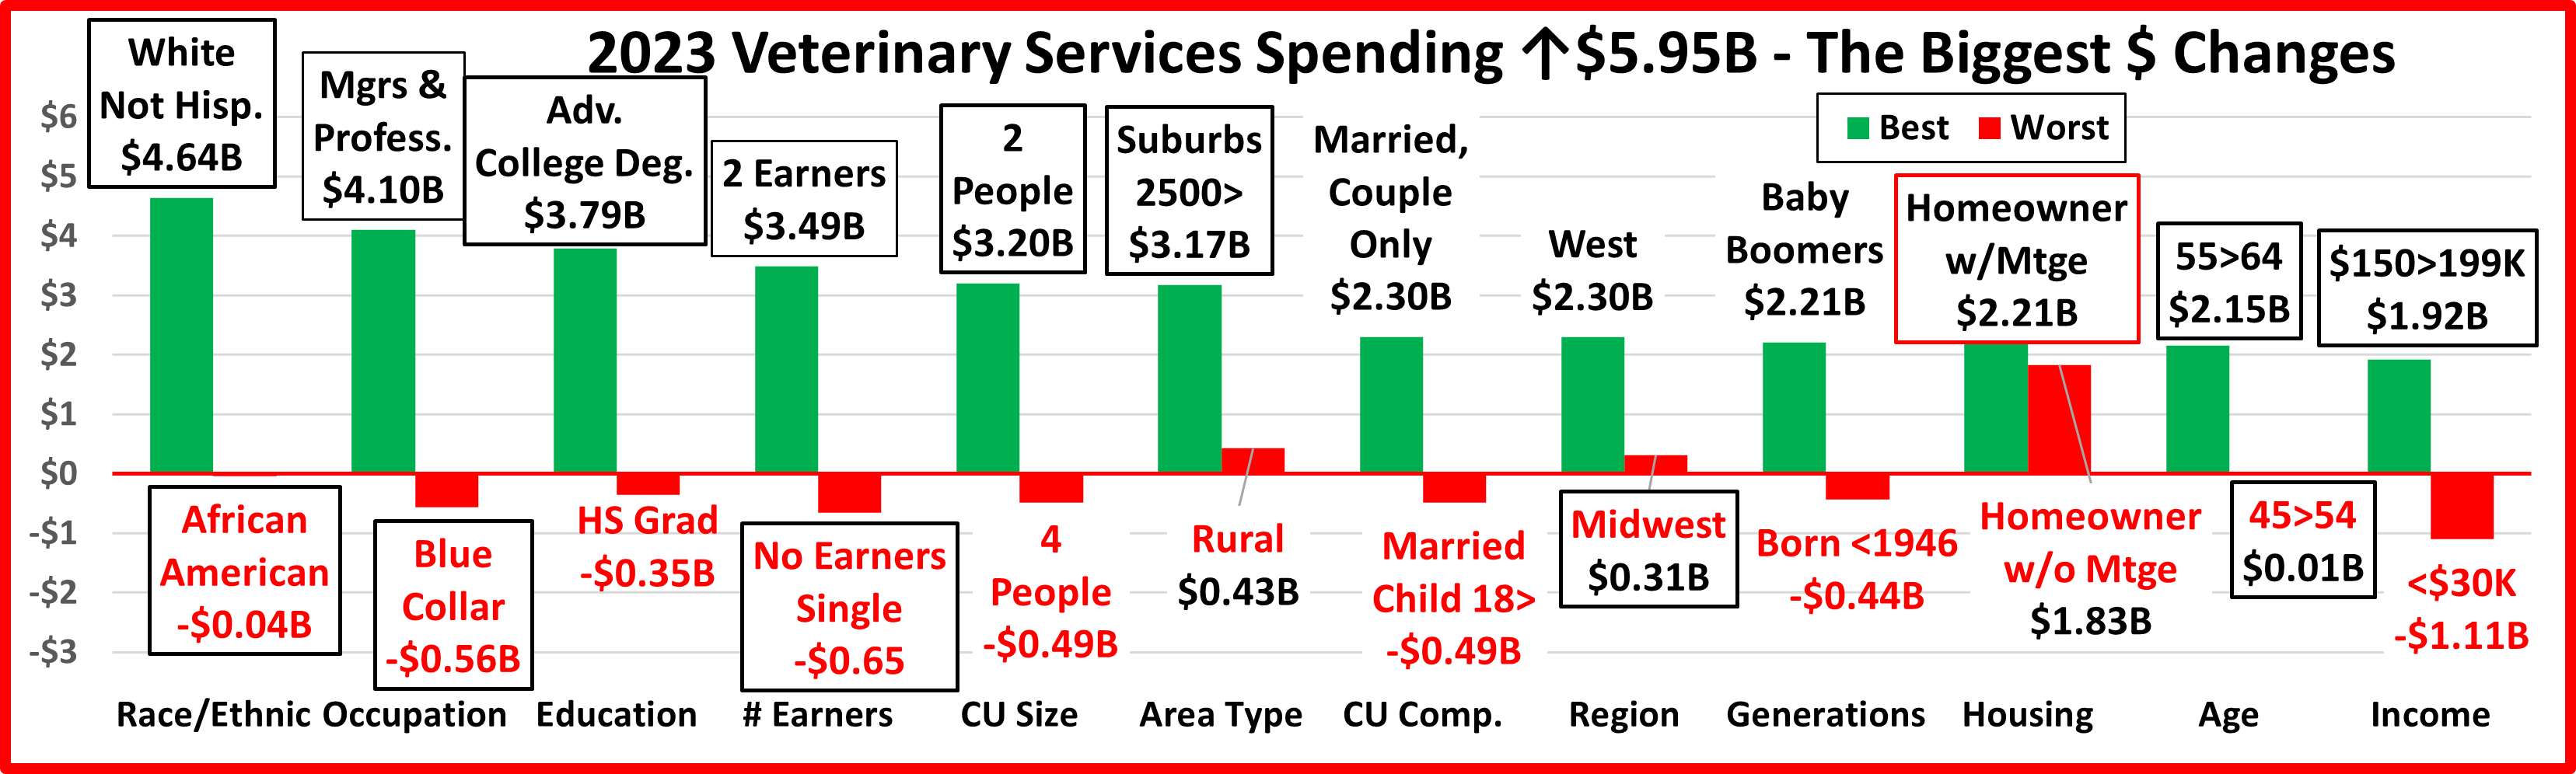
We saw some turmoil in performance. It continues here. There was 1 repeat, and 13 segments flipped from 1st to last or vice versa. Last year there were 3 repeats and 14 flips. There were no truly surprising winners and there was only 1 surprising loser – the high income, 45>54 yr olds. In 2023 there were 4 categories in which all segments spent more. In 2022, there were 3 where all spent less. Plus, in 2022, only 23% of 96 demographic segments spent more. In 2023, that grew to 82.3%. If you consider 9.4% inflation, 67.7% still spent more.
- Race/Ethnic – The winner and loser flipped.
- Winner – White, Not Hispanic– Veterinary: $30.19B; Up $4.64B (+18.2%) 2022: African Americans
- Loser – African Americans – Veterinary: $1.13B; Down $0.04B (-3.8%) 2022: White, Not Hispanic
- Comment– African American were the only group that spent less and the drop was small. Hispanics spent $1.24B, +58.7% more after a $1.12B drop in 2022. Asian Americans also spent a little more, $0.11B, +12.3%. That’s 4 consecutive years of increases for this group with a low level of pet ownership – very encouraging.
- Occupation – The winner and loser both flipped back to more “normal” positions.
- Winner – Mgrs & Professionals – Vet Spending: $14.77B; Up $4.10B (+38.4%) 2022: Blue Collar
- Loser – Blue Collar – Vet Spending: $1.36B; Down $0.56B (-29.2%) 2022: Mgrs & Professionals
- Comment – All Other/Unemployed & Self-Employed also spent less. We should also note that Retired had the 2nd largest lift, both in $ and percentage, +$1.66B, +31.6%.
- Education – Adv. College degree flipped to the top. HS Grads replaced them at the bottom.
- Winner – Adv. College Degree – Veterinary Spending: $11.85B; Up $3.79B (+47.1%) 2022: <HS Grads
- Loser – HS Grads – Veterinary Spending: $2.70B; Down $0.35B (-11.5%) 2022: Adv College Degree
- Comment – In 2023, only HS Grads or less had spending decreases. < College still spent $0.90B more in 2023, almost triple their 2022 lift. However, the big turnaround was in College Graduates. In 2022 they spent -$3.27B less than in 2021. In 2023 they spent $5.04B, +27.8% more. 85% of the Vet $ lift came from 48% of the CUs.
- # Earners – The winner and loser both flipped.
- Winner – 2 Earners – Veterinary Spending: $15.69B; Up $3.49B (+28.6%) 2022: No Earner, Single
- Loser – No Earner, Single – Veterinary Spending: $1.79B; Down $0.65B (-26.7%) 2022: 2 Earners
- Comment – No Earner, Singles had the only decrease, but No Earner, 2+ CUs spent $1.04B more. Interestingly, the highest income segment, 3+ Earners had the smallest lift, +$0.05B, +1.2%.
- # in CU – 2 People flipped to the top and 4 People replaced them on the bottom.
- Winner – 2 People – Veterinary Spending: $15.13B; Up $3.20B (+26.8%) 2022: 3 People
- Loser – 4 People – Veterinary Spending: $4.29B; Down $0.49B (-10.3%) 2022: 2 People
- Comment: In 2022, all groups spent less. In 2023, only 4 People CUs spent less. The 22>23 lift was definitely concentrated as 2 & 3 People CUs (47.7% of CUs) produced 88.4% of the lift, +$5.26B.
- Area Type – Suburbs 2500> flipped from last to 1st and Rural replaced them at the bottom.
- Winner – Suburbs 2500> – Veterinary Spending: $17.21B; Up $3.17B (+22.6%) 2022: Center City
- Loser – Rural – Veterinary Spending: $7.48B; Up $0.43B (+6.0%) 2022: Suburbs 2500>
- Comment – In 2020 & 2021 all groups spent more. In 2022, all spent less. In 2023, all spent more again. Since 2020, all segments have the same spending pattern. Center City settled into 2nd place after flipping for 3 straight years. The Suburbs 2500> have the biggest share of Vet $, 48.3% and generated 53.3% of the lift.
- CU Composition – The winner & loser are again both new.
- Winner – Married, Couple Only – Veterinary: $11.17B; Up $2.30B (+26.0%) 2022: Married, Child 6>17
- Loser – Married, Child 18> – Veterinary: $2.79B; Down $0.49B (-14.9%) 2022: Unmarried, 2+ Adults
- Comment – Single Parents also spent less. 2023 favored CUs with no children. Married, Couple only had the biggest lift and 2nd place went to Unmarried, 2+ All Adult CUs, +$2.18B, +50.9%.
- Region – The Midwest flipped to the bottom and the West replaced them on top. This ends 5 yrs of Northeast flips.
- Winner – West – Veterinary Spending: $10.32B; Up $2.30B (+28.6%) 2022: Midwest
- Loser – Midwest – Veterinary Spending: $7.93B; Up $0.31B (+4.1%) 2022: Northeast
- Comment – All Regions spent more. In 2022, only the Midwest increased spending.
- Generation – Both winner & loser are new. (CU Comp was the only other category with a new winner & loser.)
- Winner – Baby Boomers – Veterinary: $11.94B; Up $2.21B (+22.7%) 2022: Gen X
- Loser – Born <1946 – Veterinary: $1.38B; Down $0.44B (-24.0%) 2022: Millennials
- Comments – Only the oldest group spent less. In 2022, Millennials had the biggest drop. In 2023 they finished a close 2nd to the Boomers, +$2.09B, +29.3%. In 2022, Gen Z “got on board” in every aspect of Pet Parenting, including an +80.9% increase in Veterinary $. In 2023 their commitment continued to grow as Vet $ were +133%.
- Housing – Homeowners w/Mtges stayed on top while those w/o Mtges replaced Renters at the bottom.
- Winner – Homeowner w/Mtge – Veterinary: $19.11B; Up $2.21B (+13.1%) 2022: Homeowner w/Mtge
- Loser – Homeowner w/o Mtge – Veterinary$: $86B; Up $1.83B (+22.9%) 2022: Renter
- Comment – In 2023, all spent more. In 2022, all spent less but Renters had the only drop over -$1B. From 2020>2023: Homeowners w/Mtges are +$5.05B (+35.9%); Homeowners w/o Mtges are +$3.27B (+49.6%); Renters are +$2.51B (+59.9%). That’s strong, widespread growth in this category.
- Age – Both winner and loser flipped. That’s the 2nd consecutive flip for 55>64.
- Winner – 55>64 yrs – Veterinary Spending: $8.29B; Up $2.15B (+35.0%) 2022: 45>54 yrs
- Loser – 45>54 yrs – Veterinary Spending: $6.91B; Up $0.01B (+0.2%) 2022: 55>64 yrs
- Comment: All segments spent more. The lift for 45>54 was virtually no gain. In 2022 the spending skewed a little older. In 2023, it also skewed older, but the lift was pretty evenly divided by the 45>54 age group. Segments below 45 yrs old spent $2.70B more (46% of the lift). Those 55> spent $3.23B more (54% of the lift).
- Income – $150>199K flipped to the top and <$30K replaced them at the bottom.
- Winner – $150>199K – Veterinary Spending: $5.35B; Up $1.92B (+55.9%) 2022: $200K>
- Loser – <$30K – Veterinary Spending: $1.97B; Down $1.11B (-35.9%) 2022: $150>199K
- Comment – Only the <$30K & $50>69K groups spent less. All groups $70K> had $1B increases so they were close to winning. Their increases were 21+% and generated 108% of the $5.95B Veterinary lift.
We’ve now seen the winners and losers in terms of increase/decrease in Veterinary Spending $ for 12 Demographic Categories. 2022 had a $2.95B drop. The decrease brought a lot of turmoil in the $ changes. In 2023 there was a huge turnaround as spending rose $5.95B, +20.0% and reached $35.66B. The big flip in spending caused the turmoil in $ change to continue. In 2023 only 1 held their spot and 13 flipped from 1st to last or vice versa. In 2022 there were 3 holds and 14 flips – about the same. The biggest difference was that in 2022, only 23% of demographics spent more and there were 3 categories where all spent less. In 2023, 87% spent more and there were 4 categories where all segments had increases. This made the “hidden gems” much easier to find. Here are some segments that didn’t win but helped drive the big lift in Veterinary spending. These groups don’t win an award, but they certainly deserve…
HONORABLE MENTION
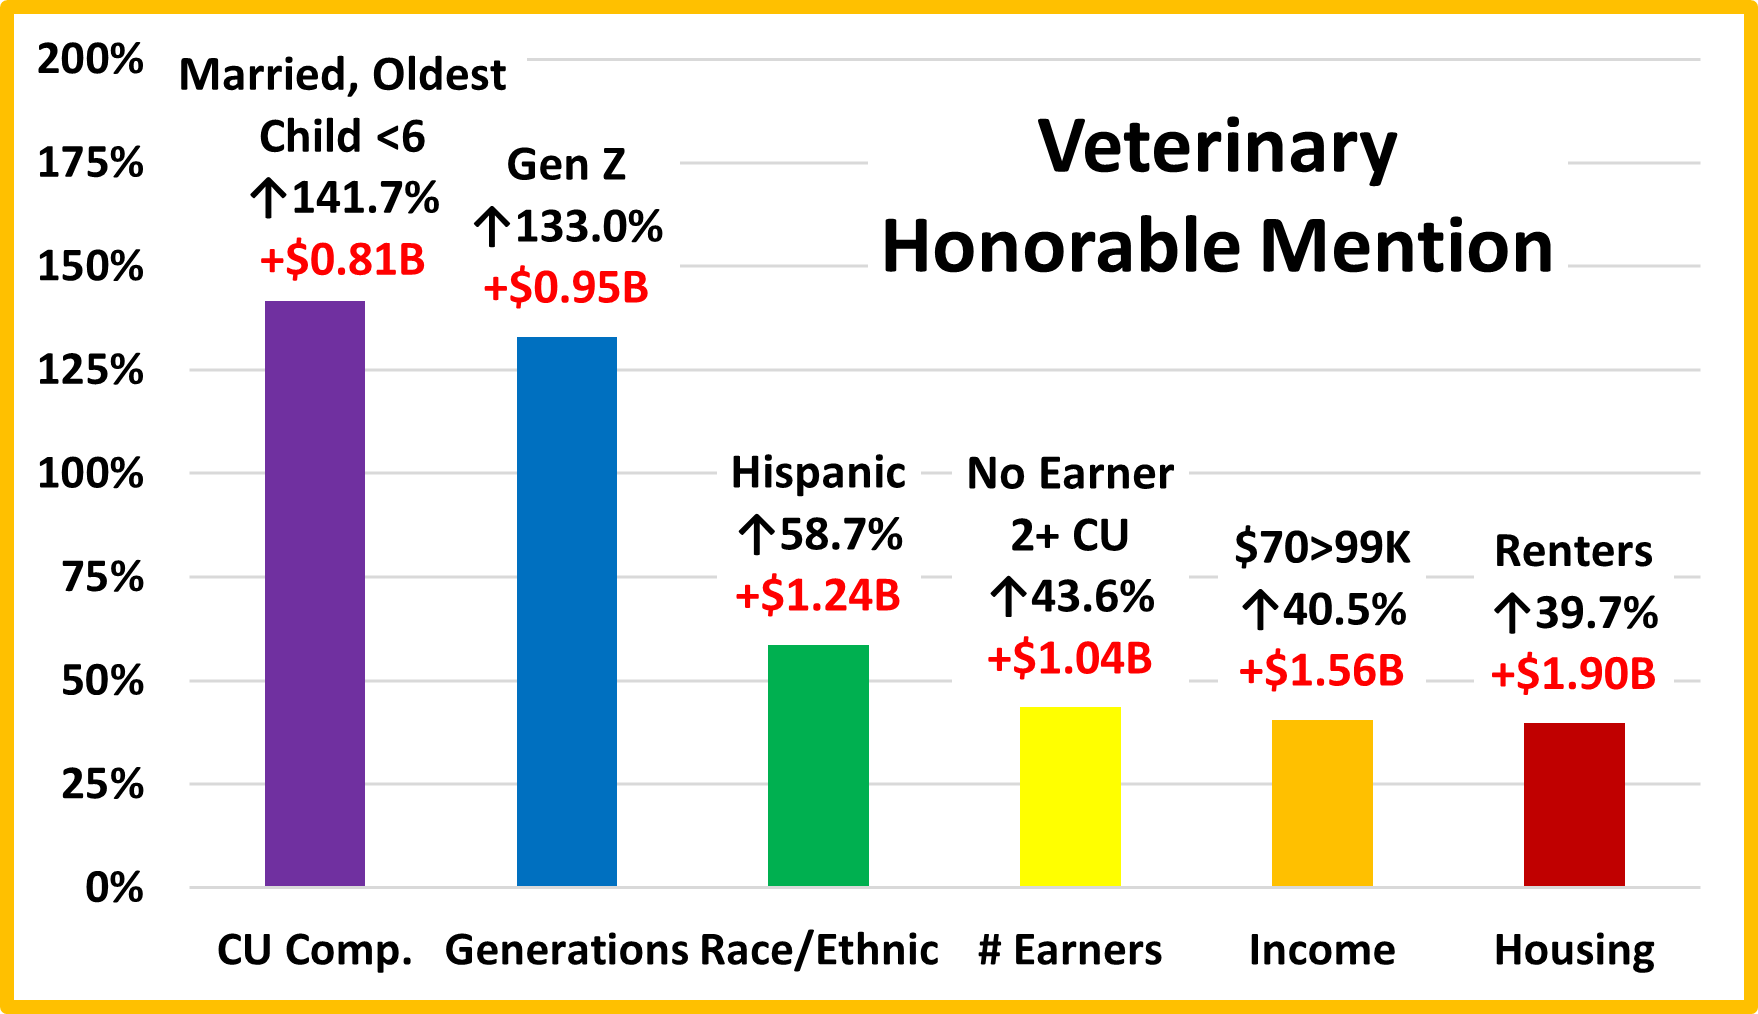
Married, Oldest Child <6 are just getting started. They have slightly above average income so the 142% lift in Vet spending shows that they are also committed to their Pet Children. Gen Z “got on board” with Pet Parenting in 2022. With big lifts in all segments, their commitment is growing even stronger in 2023. Hispanics have high pet ownership but low income. In 2022, their Vet spending fell $1B. In 2023, they found the $ for the needed services, +$1.24B. Lower incomes are always challenged by Veterinary high prices but many of the services are necessary for the health of their pets. In 2023, No Earner, 2+ CUs & $70>99K found over $1B more to spend on Vet Services. Renters also have low income, but pet ownership is growing in this segment. They had 30+% increases in the most needed segments – Pet Food & Vet Services.
Summary
In 2020 the pandemic focused Pet Parents on the needed segments. This drove a $3B increase in Veterinary $. Boomers & Millennials led the way, but the lift was widespread as 85% of demographic segments spent more. In 2021 the lift grew to a record $7.82B with 93% of all segments spending more including 9 categories where all segments had increases. In 2022, the “binge” was not repeated. Inflation also increased radically to 8.8% and spending fell -$2.95B (-9.0%). Only 23% of demographics spent more and in 3 categories all segments decreased spending.
In 2023 Inflation grew to 9.4% but the higher income groups stepped up. The $30>49K segments also found the necessary $ so their spending increased. The result was a $5.95B, +20.0% increase as Veterinary Spending reached $35.66B. In 2023, 82.3% of demographics spent more and in 4 categories all segments increased spending. Even considering the 9.4% inflation, 67.7% spent more – a big change from 2022.
The performance of big spending groups is very important in all industry segments. In Veterinary we identified 5 demographic categories with high performing (120+%) large groups. That is the same as 2022. It is 2 more than Pet Food, but 1 less than Supplies & 2 less than Services. The big groups with a high performance level in Veterinary are:
- Income: $100K> (167.7%) Performance increases with income but doesn’t reach 100+% until income reaches $70K
- CU Composition: Married Couples (127.7%) Only Married Couples (except Child <6) & All Adult CUs perform at 100+%.
- Education: College Grads (135.8%) Performance increases with education. All with an Associate’s Degree> are 100+%
- Housing: Homeowners (124.8%) Only Renters (53.8%) perform below 100%.
- Race/Ethnic: White, Not Hispanic (127.6%). Hispanics, African Americans & Asians only perform between 25% and 62%
Consumers have no control over Race/Ethnicity but can make decisions in the other categories. Income is still the most important factor. The others are important but essentially equal in performance – 125>136%. Although spending grew, the balance was basically unchanged with again 5 big groups performing over 120%. Another indication of this is that the average spending disparity between the best and worst performing segments only grew from 88.8% to 89.8%. We should note that the 50/50 spending dividing line did increase from $115K to $124K, emphasizing income’s importance.
Perhaps the biggest concern is high inflation. In 2021 spending grew 31.5% in the pandemic surge. Inflation was high at 4.2% but 84% of the growth was real. In 2022 spending fell -9.0%. Inflation was 8.8% so the amount sold was really down -16.4%. Also 77% of 96 demographic segments spent less $ but if we factor inflation into the numbers, 91% actually bought less Veterinary Services. In 2023, inflation reached a record 9.4%. Spending was +20.0% so the “real” increase was 9.7%. If high inflation continues it could have a major impact on Veterinary Spending. We’ll see.
Finally – The “Ultimate” Veterinary Services Spending CU consists of 4 people – a married couple with children. Their oldest child, still at home is under 18. They are 55>64 years old. They are White, but not of Hispanic origin. Both work. At least one of them has an Adv. College Degree and is a Mgr/Professional. Their total income is $200K>. They live in a small suburb, adjacent to a big city in the Western U.S. and are still paying off the mortgage on their home.


What is your data source for the analysis? Was it your own research or from other sources?
All data comes from the Consumer Expenditure Survey, managed by the US BLS. The field work is done by the Census Bureau. They also ensure that the 42,000 diaries and interviews are from a group that is demographically accurate for the U.S. population.