
2023 U.S. PET FOOD SPENDING $45.50B…Up ↑$6.81B
Total Pet spending reached a record high of $117.60B, up $14.89B (+14.5%). All segments increased sales. Pet Food and Veterinary spending had double digit growth while Supplies & Services $ were up 4.9+%. The big news was Pet Food. They had a record increase of $6.81B and are up 32% from 2021. However, strong inflation continued in every segment but supplies and drove much of the big lift. Here are the 2023 spending specifics
- Pet Food – $45.50B; Up $6.81B (+17.6%)
- Pets & Supplies – $23.02B; Up $1.08B (+4.9%)
- Veterinary – $35.66B; Up $5.95B (+20.0%)
- Pet Services – $13.42B; Up $1.05B (+8.5%)
The industry truly is a “sum” of its integral segments, and each segment has very specific and often very different buying behavior from the many consumer demographic segments. For this reason, we’re going to analyze each of the industry segments first. This will put the final analysis of Total Pet’s 2023 Spending into better perspective. Note: The numbers in this report come from or are calculated by using data from the current and past US BLS Consumer Expenditure Surveys. In 2023, this was gathered by the U.S. Census Bureau from over 42,000 interviews and spending diaries. The final data was then compiled and published by the US BLS. All inflation numbers are also provided by the US BLS.
We will start with the largest Segment, Pet Food (and Treats). In 2023 Pet Food Spending totaled $45.50B in the U.S., a $6.81B (+17.6%) increase from 2023. Pet Food inflation was 10.6% in 2023 so 64% of the record lift came from higher prices. In earlier research we discovered a distinct, long-term pattern in Pet Food Spending. In 2018 we broke the pattern due to outside influences – 1st the FDA warning, then with COVID in 2020. Here is Pet Food Spending since 1997 in full Retail Dollars and adjusted for inflation.
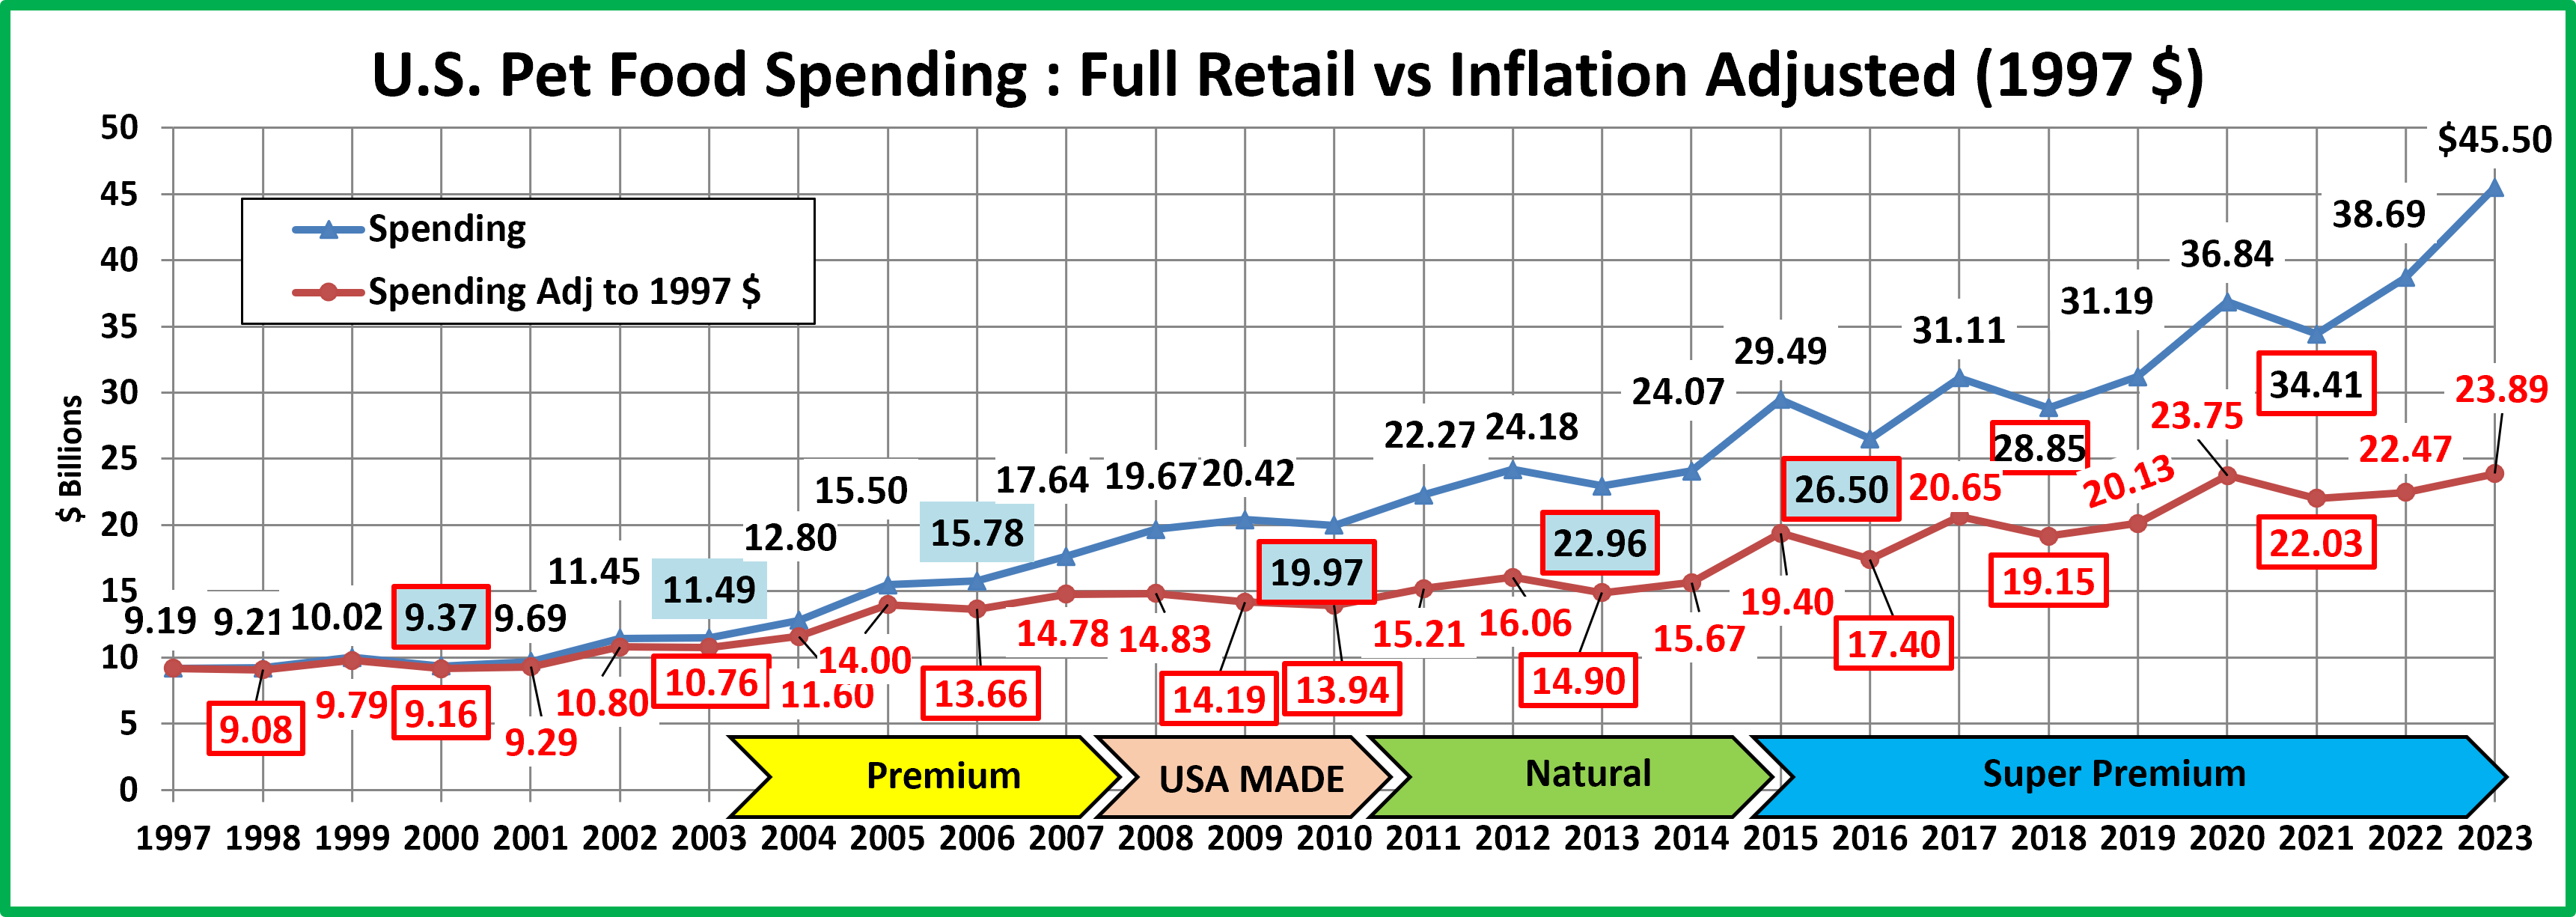
The pattern began in 1997. Retail Pet Food Spending increases for 2 consecutive years then reaches a plateau year or even drops. There was a notable exception in the period from 2006 to 2010. During this time, there were two traumas which directly impacted the Pet Food Retail market. The first was the Melamine recall, which resulted in radically increased prices as consumers insisted on made in USA products with all USA ingredients. The second affected everyone – the great Recession in 2009. This was the first time that annual U.S. retail spending had declined since 1956. The net result was that the plateau period was extended to include both 2009 and 2010.
For 20 years, Pet Food was driven by short term trends. A new trend catches the consumers’ attention and grows …for 2 years. Then sales plateau or even drop…and move to the next “must have”. After 2014, the changes became bigger and the situation got more complex due to a number of factors starting with the move to high priced super premium foods, but including increased competition, especially from the internet, and behavioral changes, like increased value shopping. In 2018, outside influences came into prominence. The first was the FDA warning on Grain Free dog food. This caused many Pet Parents to back away from certain foods. When the warning was declared bogus, the Food segment began to recover. Then came COVID. Fear of possible shortages caused some groups to binge buy food. That ended and spending dipped in 2021. It turned up again in 2022>23. However, much of the lift was due to 10+% inflation. Of note: Considering inflation, only 40% of the 97>23 growth is real. Now, let’s take a closer look at spending since 2014.
First, some specifics behind the $6.81B (+17.6%) increase to $45.50B. In 2023, the average U.S. Household spent a total of $338.33 on Pet Food. This was an +17.2% increase from the $288.75 spent in 2022, which doesn’t exactly “add up” to the +17.6% increase in total Food Spending. With additional data provided from the US BLS, here is what happened.
- 0.4% more U.S. CUs
- Spent 10.3% more $
- 6.3% more often
By the way, if 68% of U.S. CUs are pet parents then their annual Pet Food Spending is $497.54. Here’s a rolling history.
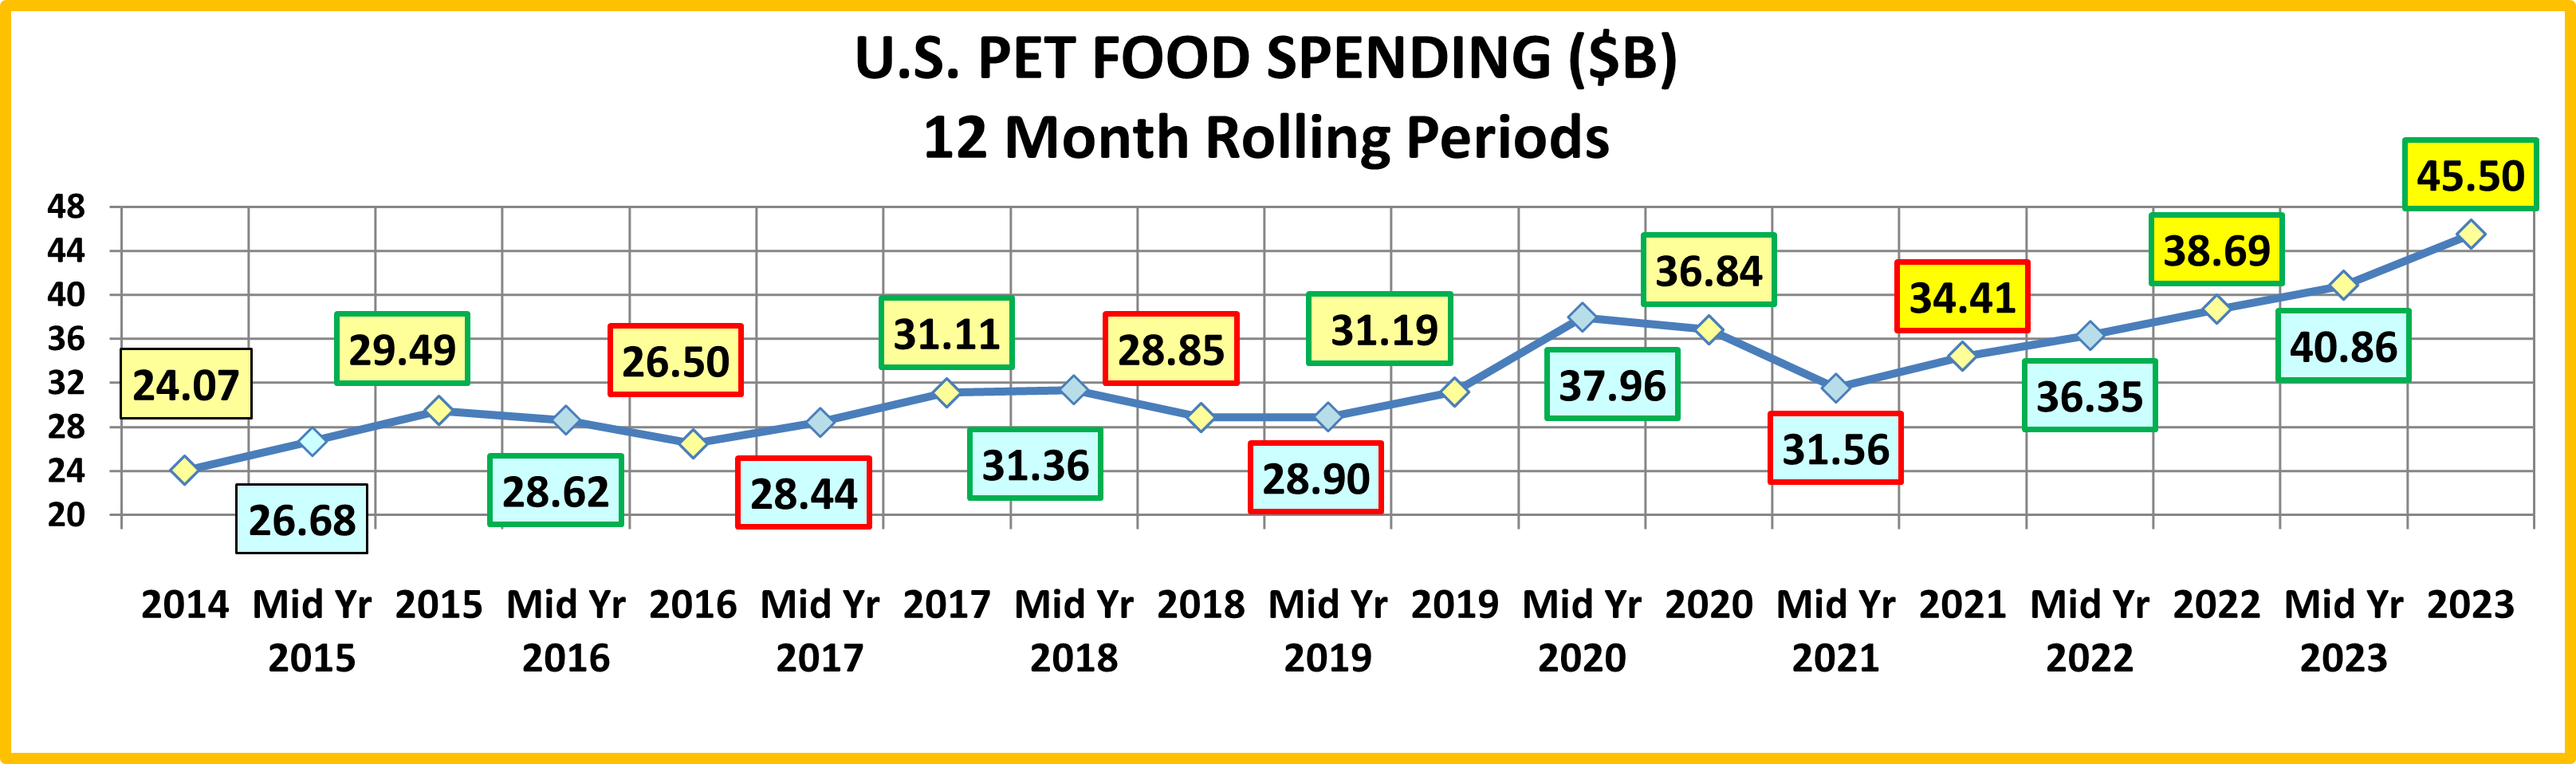
2014 marks the beginning of the Super Premium era. It began in the 2nd half of 2014 with the 25>34-year-old Millennials making the 1st move. In 2015 the Baby Boomers got on board in a big way, producing a $5.42B increase in spending, the biggest lift in history at the time. 2016 saw a spending change that was accelerated by the high prices of Super Premium Pet Foods. After consumers upgraded to a more expensive pet food, their #1 priority became, “Where can I buy it for less?” Value Shopping on the internet was a major contributing factor in the big spending drop in 2016.
2017 was an up year which should have been due to a “must have” trend. However, a closer look at the data showed that the $4B increase in Pet Food spending in 2017 came not from a new trend but from a deeper demographic penetration of Super Premium foods. Value shopping in a highly competitive market, especially on the internet, had made Super Premium pet foods more accessible to a broad swath of consumers.
Like Pet Food, human behavior has changed over the years in regard to our pets. In the 90’s, Pet Owners became Pet Parents. Then, after 2000 we began truly humanizing our pets, which is very accurately reflected in the evolution of Pet Food. We became more focused on fulfilling the health needs of our pets, beginning with the first move to premium foods in 2004. This radically increased after the Melamine scare in 2007. Now consumers read pet food labels, research ingredients and expect their pet foods to meet the same quality standards as the best human foods. This was very evident in 2018. It should have been a year of increased spending but the consumers’ reaction to the FDA grain free warning threw the pattern out the window. In 2019 the warning lost credibility. Pet Food spending stabilized in the 1st half of the year and then grew by $2.3B in the 2nd half. Some Pet Parents began to return to the topline Super Premium Foods while others opted for even more expensive varieties. Also, new groups got on board the Super Premium Express.
After the 2019 recovery came the pandemic of 2020. There is nothing more necessary to a Pet Parent than pet food. This spurred binge buying, especially in the 1st half of the year and drove the biggest annual spending increase in history. However, binge buying doesn’t increase usage and it causes an overstock in home supply. In 2021, Pets “ate down” the extra food so spending fell. Another factor was the ongoing strong search for value & convenience which continues to drive many consumers online. In 2022, Pet Food spending returned to a more normal pattern. In 2023, there were 0.4% more CUs. They spent 10% more and bought 6% more frequently. Inflation was a big factor in the spending increase in transactions. The increase in frequency came from more regularly scheduled deliveries and in an effort to lower the transaction price due to skyrocketing inflation, some pet parents also downsized their purchases but bought more often.
The growth of Pet Food spending since 2014 reflects the rise of Super Premium but also another trend – the spectacular increase in the number and use of Pet Medications and Supplements, which are often produced in the form of treats. Together, the strength of Pet Food and these product subcategories reflect the Pet Parents’ absolute number 1 priority – the health, wellbeing and safety of their Pet Children, which starts with the quality of their food.
Now let’s look at some specific 2023 Pet Food Spending Demographics. The first is income. Prior to 2014 it was less of a factor in Food spending. However, the move to Super Premium has brought it more to the forefront. In 2015 the spending of the over $70K group exceeded the <$70K for the first time. In 2023, both <$70K & $70K> had 16+% lifts but <$70K was still only 64% of the $70K> spending. All big groups were up but $150K> had the biggest increase. In 2015, the 50/50 divide on Pet Food spending was about $70K. By 2020, it was up to $107K, breaking the $100K barrier. In 2021 it fell to $92K then down to $91K in 2022. In 2023 it rose to $93K. That’s 9% less than the average CU income but 15% more than the median income. Higher income is still important in Pet Food spending. $30>39K income CUs and all over $70K have 100+% performance ($ Share/CU Share) but the $150>199K group is the best at 149%. The chart below shows annual spending for major income groups from 2017>2023. This should put the 2023 numbers into better perspective.
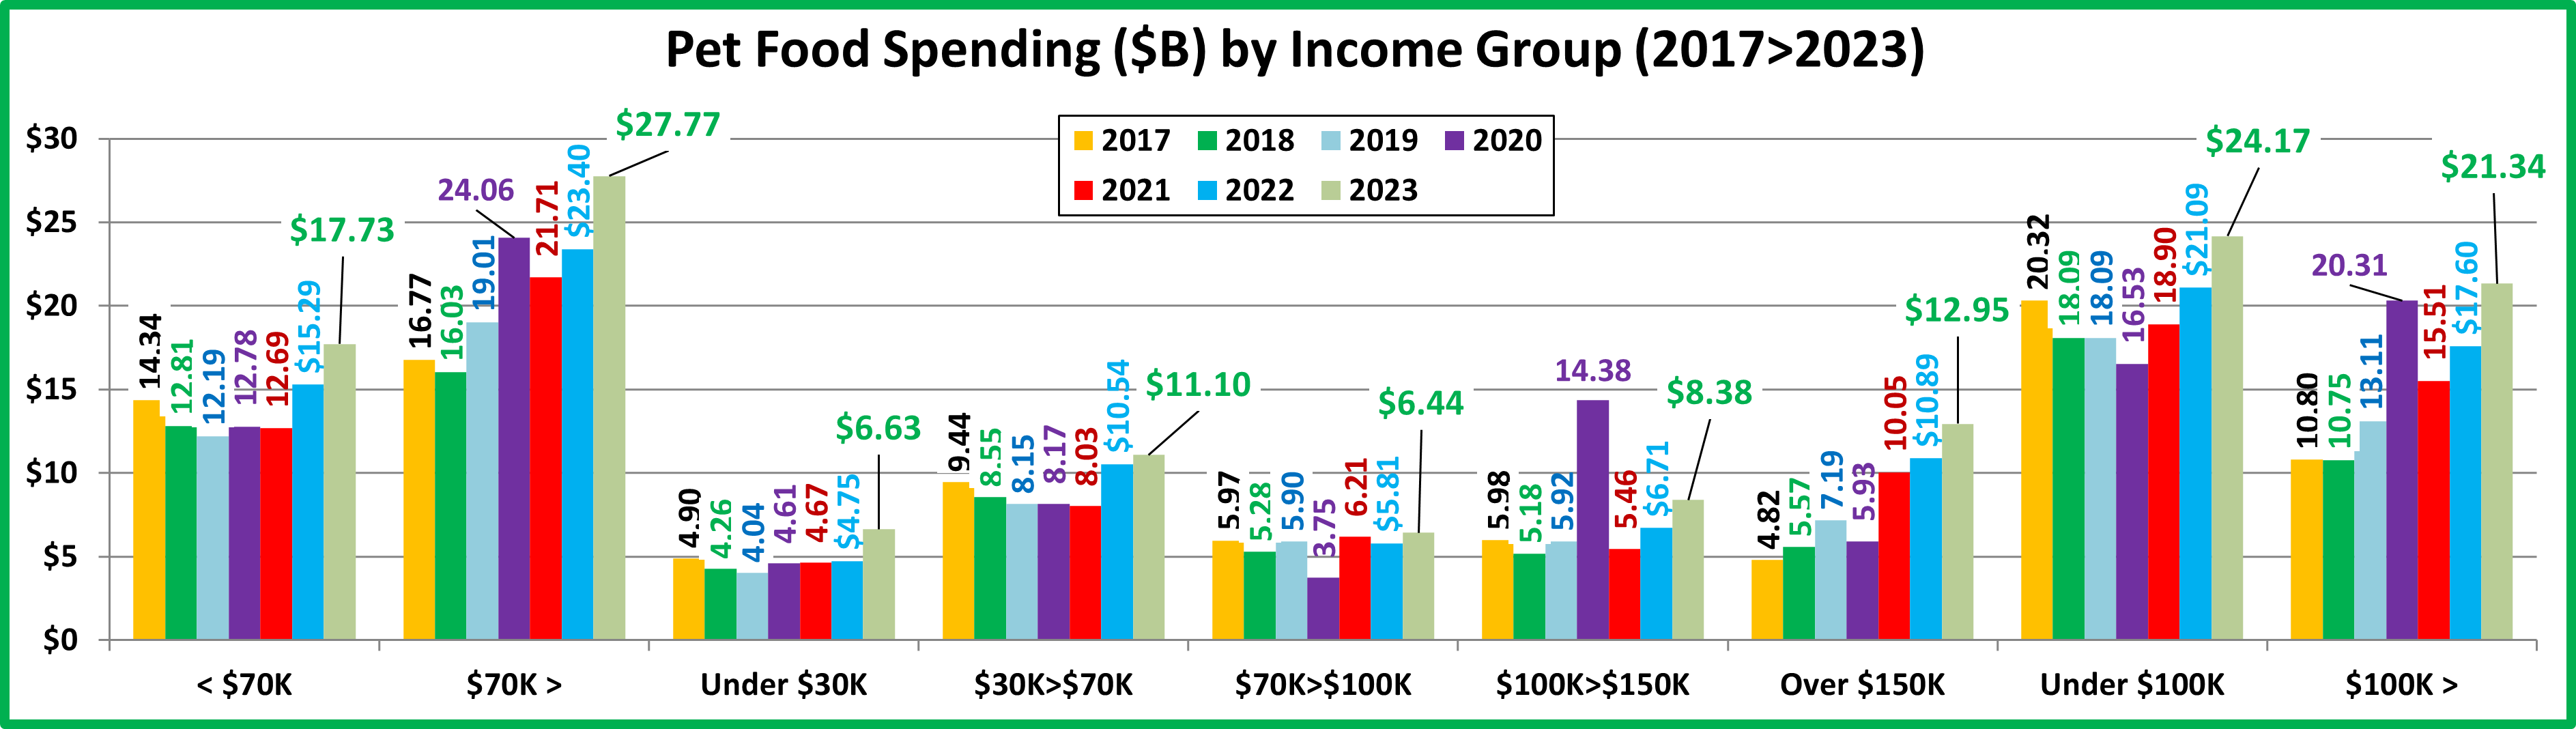
In 2023, all big groups spent more on Food. Previously, 2017 was the only year since 2015 with spending growth in every major income group. Since 2017, we have seen the major impact on various groups by outside influences. In mid-2018 it was the FDA grain free warning. In 2020 it was the pandemic and in 2022 it was the first inflation spike. In 2023, consumers adapted to high prices. However, any group with a lift below 10.6% actually bought less Pet Food in 2023.
2023 National: $338.33 per CU (+17.2%); $45.50B; Up $6.81B (+17.6%); 2017>2023: Up $14.39B (+46.3%); Avg: +6.5%
The biggest lifts came from the Highest and lowest income groups, which clearly demonstrates the importance of their children’s health to Pet Parents. The smallest spending increase was by the low income $30>70K group. This was not unexpected because in 2022 they had the largest increase.
Here are 2023 specifics:
- Under $30K: (21.3% of CU’s) – $230.58 per CU (+45.7%) – $6.63B – Up $1.89B (+39.7%). Obviously, this group is very price sensitive. The number of CU’s was down 10.4% in 2023. Much of the drop was due to an 8.3% lift in average income. Their CU count is down 30.4% from 2015 but the average U.S. CU income is up 46.2%. Their spending lift in 2023 was likely due to an upgrade in Food. They are still fully committed to their Pets. This is evidenced by the fact that they spend 1.16% of their Total CU expenditures on their pets, including 0.68% on Pet Food. The national averages are: Total Pet: 1.13%; Pet Food: 0.44%.
- $30K>$70K: (28.3% of CU’s) – $291.97 per CU (+12.1%) – $11.10B – Up $0.55B (+5.3%). They are also very price sensitive, so inflation had an impact. Their average income was up 0.3% while the national average increased by 8.3%. They had a 2.0% decrease in the number of CUs and a 2.4% increase in CU spending. Their total Pet Food spending was up but it was 100% driven by the $30>39K group. The $30>39K group lost 1.7% in CUs but CU spending was +73.1% & $ were +$1.74B (+70.8%). The $40>49K group fell -3.2% in CUs and their CU Food spending was -15.3%. Their $ were -$0.82B (-28.0%). $50>69K lost -1.4% in CUs and spent -4.4% less per CU on Pet Food. Their Pet Food Spending dropped by $0.4B (-7.7%). Behavior was mixed – upgrading, downgrading & value shopping. They are still committed to their pets, spending 1.18% of total expenditures on their pets and 0.55% on Pet Food.
- $70K>$100K: (14.1% of CU’s) – $316.88 per CU (+4.6%) – $6.44B – Up $0.63B (+10.9%). This group has a regular up/down spending pattern. They committed to Super Premium food in 2017, but they have been very sensitive to outside influences – the FDA warning in 2018, COVID in 2020 and inflation in 2022. They have big family responsibilities and are under monetary pressure. They got used to inflation and made a comeback in 2023.
- $100>150K (16.6% of CU’s) – $399.09 per CU (+22.5%) – $8.38B – Up $1.67B (+25.0%). This group was the driver in the binge buying of Food in 2020. It was pure emotion, but they had the $ to do it. In 2021, they had an expected big drop. In 2022, mostly due to inflation and a 9.6% increase in CU’s they had a 23% increase in $. In 2023 they had 7.4% more CUs but spent 22.5% more $ per CU. Pet spending is 1.23% of their total; Pet Food is .44% = Commitment
- $150K> (19.8% of CU’s) – $490.64 per CU (+7.1%) – $12.95B – Up $2.06B (+19.0%). Their Pet Food CU spending grew by 7.1%. With a 12.3% increase in CUs, their total $ were up 19.0%. When you factor inflation into the numbers, they actually bought 3.1% less pet food per CU but 7.5% more overall. In performance, share of $/share of CUs, their score of 144.0% is the clear winner. Higher income is still important.
The pandemic certainly caused turmoil. First, the fear-based binge buy which caused a record increase in 2020. This couldn’t be repeated so spending fell in 2021. Spending returned to more normal, positive behavior in 2022 as only the $70>100K group spent less. In 2023 Inflation was even higher at 10.6% but the welfare of their Pet children mattered more than the price so most Pet Parents just paid more. The record lift was driven by <$40K & $100K>. It is significant in this 2nd year of record inflation that the 50/50 income divide in Pet Food $ rose only slightly from $91K to $93K.
Now, Spending by Age Group…

2023 National: $338.33 per CU (+17.2%); $45.50B; Up $6.81B (+17.6%); 2017>2023 – Up $14.39B (+46.3%); Avg: +6.5%
The <45 and 65> yr-old groups spent more, while 45>64 yr-olds spent less.
- 65>74 (16.0% of CU’s) – $413.49 per CU (+31.4%) – $9.00B – Up $2.35B (+35.4%). This group is all Baby Boomers. They are starting to retire but many are still working (0.7 per CU). Their Pets are a major priority. They spent 1.40% of their total CU expenditures on their pets and 0.64% on Pet Food, the highest percentages of any group. They are also the only group to spend more on Pet Food every year since 2016. In 2023, 3.1% more CUs spent 16.4% more $, 12.9% more often. They overcame the impact of Inflation and continued their commitment to their pet children.
- 55>64 (17.8% of CU’s) – $351.72 per CU (-2.2%) – $8.48B – Down $0.12B (-1.4%). This group has been at the forefront of recent major spending swings. In 2015 they upgraded to Super Premium. In 2016 they shopped for a better price. In 2017 they led a deeper penetration of the upgrade. In 2018 they had a -$3.5B reaction to the FDA warning. They began to recover in 2019 but then came 2020, which saw a huge lift in spending. There were 3 major factors. First was panic, binge buying due to pandemic. They also were still recovering from the FDA warning. Finally, the pandemic caused the loss of over 2 million <25 CUs. Many of them moved back with their parents bringing their pets with them. In 2021, there was a big drop in food $ as they “ate up” the “panic” extra stock and many of their kids moved out again. In 2022 inflation brought a big lift. In 2023 they increased value shopping as 0.8% more CUs spent 5.8% less $, 3.8% more often.
- 35<44 (17.5% of CU’s) – $352.55 per CU (+16.6%) – $8.43B – Up $1.25B (+17.4%). They are 2nd in income and CU spending but have the biggest families. Until 2023 their spending pattern matched the 45>54 yr-olds. In 2023 their total Pet Food spending exceeded the older group as 0.7% more CUs spent 11.6% more $, 4.5% more often.
- 45>54 (16.9% of CU’s) – $336.12 per CU (-4.9%) – $7.45B – Down $0.42B (-5.3%). This group is #1 in income and total CU expenditures. Up until 2015 they were #1 in Pet Food spending. They didn’t “buy in” to Super Premium until 2017. They were negatively impacted by the FDA warning but strongly rebounded. In 2020, their spending dropped significantly. Much of the decrease was due to value shopping on the internet. In 2021, they opted for even more expensive food, spending 24% more on each purchase. In 2022, despite strong inflation, their purchase frequency and $ grew. In 2023, this reversed as 0.4% fewer CUs spent 3.7% more $, 8.3% less often. The result: -5.3% in $.
- 25>34 (15.7% of CU’s) – $328.49 per CU (+46.5%) – $6.82B – Up $2.02B (+42.2%). In the early Super Premium years their spending often foreshadowed the overall market for the next year. In pandemic 2020 they spent 22.3% more, then held their ground in 21>22. In 23, their $ surged as 2.9% fewer CUs spent 35.2% more $, 8.3% more often.
- 75> (11.4% of CU’s) – $233.03 per CU (+53.2%) – $57B – Up $1.35B (+60.5%). Pet Parenting becomes harder as we age. They strongly moved to Super Premium Food in 2021. In 2022, inflation impacted them as many downgraded. In 2023 with an influx of Boomers, they strongly rebounded. 4.8% more CUs spent 28.7% more $, 19.0% more often
- <25 (4.5% of CU’s) – $271.36 per CU (+37.0%) – $1.75B – Up $0.37B (+27.1%). Many moved in with other adults or got married. They value shopped, but also added pets. 7.2% less CUs spent 6.3% more $, 28.8% more often.
In 2020 the 55>64 yr olds binge bought Pet Food. In 2021 their spending naturally plummeted, the only decrease by any age group. In 2022 we had high inflation. It affected everyone. In 2023, driven by both the older and younger groups, spending surged. Pricing matters but quality pet food remains a higher priority for Pet Parents.
Next, let’s take a look at some other key demographic “movers” in 2023 Pet Food Spending. The segments that are outlined in black “flipped” from 1st to last or vice versa from 2021. The red outline stayed the same.

The first thing that you notice is that the biggest increases are almost always radically larger than the biggest decreases. We should also note that in 5 demographic categories all segments spent more on Pet Food in 2023 than in 2022. The lift was also widespread as 87.5% of 96 demographic segments spent more in 2022. These are good signs that Pet Food spending is doing well.
You also see that 4 of the 24 segments flipped from last to first or vice versa. Last year there were 12. 4 held their position from 2022. In 2022 there were 2. There was a lot of change but a little more stability.
Only 4 of the winners are the “usual suspects”:
- Suburbs 2500> ● White, Not Hispanic ● BA/BS Degree ● Homeowners, w/Mtg
But there are 5 surprise winners:
- Retired ● Singles (1 Person) ● 65>74 ● <$30K ● No Earner, Single
These winners indicate that despite high inflation and the resulting high prices, there is a strong commitment to premium pet foods that is widespread across demographic categories.
Among the losers, 4 of the segments are not unexpected, but Asians and Center City had spending increases:
- Asian ● Center City ● Single Parents ● $40>49K
There were 5 surprises. Rural had a big increase. The others are high income. The drop was likely due to value shopping.
- Gen X ● Managers & Professionals ● Rural ● 45>54 ● 3+ Earners
The $6.81B (+17.6%) increase was the biggest in history. It was widespread across 87.5% of 96 demographic segments. However, 10.6% inflation was a problem. The amount of Pet Food sold in 2023 was really only +6.3% from 2022 but 80% of segments still bought more. Pet Food spending is now up $14.3B from 2019, +45.9%, a growth rate of 9.9%, 87% more than the 5.3% from 2014>19. The downside is that 59% of that growth came from inflation…almost all in 22>23. Real 19>23 growth: 4.4%. Inflation fell below 10% in August 23. We’ll see what happens to prices & spending.

