Pet Spending Gets Its Own Category
We made the grade. Expenditures on Pets are now being reported as a separate entity on the annual Consumer Expenditure Survey done by the Census Bureau on behalf of the U.S. Bureau of Labor and Statistics. Previously, Pet expenditures were bundled with toys and playground equipment. (go figure)
What is the CE Survey and what does it mean? The first Consumer Expenditure Survey was done over a 3 year period in 1888-91 to look at worker’s spending habits. The spending of our workers was considered to be a factor in U.S. production costs and impactful on foreign trade. Over the next 90 years, 7 more expenditure surveys were done for various reasons usually in response to radically rising prices, a depression or an impending or current war.
The rapidly changing economic conditions of the 1970’s highlighted the need for more timely data. In late 1979 the current program of annual reports was begun. The primary purpose was and is to collect data to revise the pricing sample used in the Consumer Price Index and to provide information on the spending patterns on U.S. households from the viewpoint of a variety of demographics.
Since the CPI has become such an important factor in U.S. fiscal policy making, the accuracy is of paramount importance. The CE survey is somewhat complicated and the methodology is constantly being reviewed and revised to facilitate the process. Basically, it consists of 5 consecutive quarterly interview surveys with each participant in conjunction with a separate “spending” diary survey. This data is then merged into a summary report. The participating households change every year. (The households are selected but participation is voluntary.)
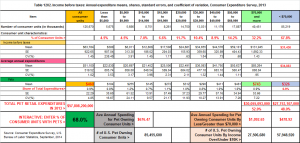
OK, enough background. The report lists 100 categories and subcategories of expenditures. I have cut it down to the “pet-essential” information and added some calculations. Here’s what the Pet Expenditures for 2013 look like from the viewpoint of household income.
Clarification: The study is based upon Consumer units. The term Consumer Unit is often used interchangeably with household but a household can have more than 1 financially independent consumer unit; ex: boarders, dormitory situations, permanent hotel residents, etc. The number of consumer units is always slightly greater (1-2%) than the number of households. The key is financially independent buying decisions. For our purposes the difference is not significant.
KEY DATA
- Total Pet Expenditures in 2013 – $57.8B. This is a little higher (3.8%) than the APPA reported number of $55.7B, but very close.
- $30.0B (52%) spent by consumer units (CU’s) with income over $70K
- 40.5 million CU’s (32.2%)
- $27.8B (48%) spent by CU’s with income less than $70K
- 85.2 million CU’s (67.8%)
- $30.0B (52%) spent by consumer units (CU’s) with income over $70K
- Pet Expenditures per CU (all CU’s – pet owning & non-pet owning)
- $460 per year
- $743 for CU’s with income over $70K
- $326 for CU’s with income less than $70K
- $460 per year
- Pet Expenditures for pet owning CU’s.
- Used 68% of CU’s (APPA number for % of households with a pet(s) )
- $676 per year (85.5 M Pet owning CU’s)
- $1093 for CU’s with income over $70K (27.5M CU’s)
- $479 for CU’s with income less than $70K (57.9M CU’s)
OBSERVATIONS
The results from this survey, while not in exact agreement with other sources, reinforce the size of the Pet Market and the spending in regard to income demographics. It confirms that slightly over 50% of the spending on pets comes from households with an income of $70K or more. This supports the assertion that there definitely is a market for “higher ticket” Pet items.
However, we also need to remember that $70K is not what it once was. Since 1997, the U.S. Dollar has lost 45% of its buying power. The numbers also highlight the spending disparity that goes along with income disparity. The under $70K households spend less than less than half as much on their pets as the over $70K group…and there are twice as as many of them – 58 million. In a non-pet related fact, take a look at the average total spending for the under $70K group. They spent 10% more than they made – usually, not a good long term plan.
Under $70K or over $70K, Americans are looking for a value. I believe that we are seeing this reflected in the current pricing deflation in Food and Supplies and in the slowed growth in the amount of Veterinary Services. There is also a retail consumer “migration” going on with Supercenters, Value Stores and the Internet becoming favored destinations. All these are issues which should be addressed.
In comparison to many other categories, the growth of the U.S. Pet Market has truly been a “success” story over the past 20 years. Driven by America’s growing love for their companion animals and nurtured by organizations, manufacturers and retailers, the Pet Market has become an economic force in the consumer marketplace. As you recall, the U.S. government first took note of the significance of the market back in 1997 when they established separate CPI measurements for each of the Pet Segments. In their most recent Consumer Expenditure Survey, published last month, for the first time they separated spending on Pets as it’s own category. This is another piece in the puzzle which will give industry professionals more data from which to make more informed and better decisions – critical to maintaining the industry’s strength.
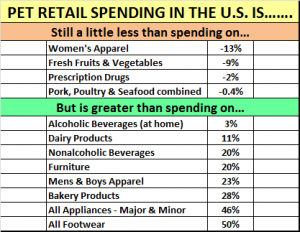
On a final note, let’s put the $58B in perspective. In 2013, U.S. consumers spent $5 Trillion dollars at retail. Spending on Pets was about 1.2% of the total. We are definitely becoming a bigger “drop in the consumer spending bucket”. Take a look at how we compare to some other categories.
The CPI for September will be released later this month. In recent years, September has been the low point in Pet Prices for the year. I will post an update as soon as possible.


$667 per pet household.
~$55 per month.
(taking into account cost of pet food.)
I think that’s about right.
I also feel like people aren’t adopting as many pets as they used to. so there are fewer households spending $667.