U.S. PET FOOD SPENDING $28.90B (↓$2.46B): MID-YEAR 2019 UPDATE
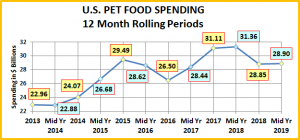
The US BLS just released their Mid-Year Update of the Consumer Expenditure Survey covering the period 7/1/2018 to 6/30/2019. The report shows Pet Food (& Treat) Annual Spending at $28.90B, down $2.46B (-7.8%). The following charts and observations were prepared from calculations based upon data from that report and earlier ones. The first chart will help put the $28.90B into historical perspective and truly show you the roller coaster ride that is Pet Food Spending.
Here are the current numbers:
- Mid 2019: $28.90B; ↓$2.46B (-7.8%) from Mid-18. The net -$2.46B in Mid 2019 came from:
- Jul>Dec 2018: Down $2.51B from 2017.
- Jan>Jun 2019: Up $0.05B from 2018.
Historical research has shown that Pet Food spending has been on a roller coaster since 2000, with 2 years up, followed by a flat or even declining year. This up and down “ride” has been driven by a succession of Food trends. The most recent were “Natural” in 2011 and “Super Premium” in 2014. Another factor was added in 2013 – deflation. As consumers opted for higher quality, more expensive pet food, competition became more intense, with the Internet now becoming a key player. 2013 was a definitely a game changer for this segment as it began an extended period of deflation which continued through 2018. Midway through 2018, Pet Food prices were still 2.3% lower than in 2013.
The spending drops in 2013 and 2016 were driven by pet parents value shopping for their recently upgraded pet food.
As it turns out, 2014 brought out yet another new factor in Pet Food spending. For over 30 years Baby Boomers have been the leaders in the Pet Food, both in spending and in adopting new products. They still spend the most, but it turns out that the 25>34 year old Millennials led the movement to Super Premium in late 2014. The older groups, especially Boomers followed in 2015 and spending rose $5.4B. At the same time, the Pet Food spending of the 25>34 yr olds dropped. At first, we thought they had rolled back their upgrade. However, it turns out they were leading the way in another element of the trend to Super Premium – value shopping. The Boomers once again followed their lead and spending fell -$2.99B in 2016. For consumers, the Super Premium upgrade movement consisted of 3 stages:
- Trial – The consumer considers the benefits vs the high price and decides to try it out. Usually from a retail outlet.
- Commitment – After a period of time, the consumer is satisfied and is committed to the food.
- Value Shop – After commitment, the “driver” is to find a cheaper price! – The Internet, Mass Market, Private label
This brought us to 2017. Time for a new “must have” trend. That didn’t happen but the competitive pricing situation brought about another change. Recent food trends have been driven by the higher income and higher education demographics. However, the “value” of Super Premium was established and now more “available”. Blue Collar workers led a new wave of spending, +$4.6B, as Super Premium more deeply penetrated the market. After the big lift in 2017, 2018 started off slowly, +$0.25B. Then came the FDA warning on grain free dog food. Many of the recent Super Premium converts immediately rolled back their upgrade and spending fell -$2.51B. This 2018 decrease broke a 20 year spending pattern. What came next? In the 1st half of 2019, Pet Food spending was stable, +$0.05B.
Let’s look deeper, starting with the 2 most popular demographic measures – age & income. The graphs will show both the current and previous 12 months $ as well as 2018 yearend. This will allow you to track the spending changes between halves.
The first graph is Income, which has been shown to be the single most important factor in increased Pet Spending. Here’s how you get the change for each half using the $150K+ group as an example:
$150K+ Mid-yr Total Spending Change: $6.05B – $5.02B = Up $1.03B (Note green outline = increase; red outline = decrease)
- 2nd half of 2018: Subtract Mid-17 ($5.02B) from Total 2018 ($5.57B) = Spending was up $0.55B in 2nd half of 2018.
- 1st half of 2019: Subtract Total 2018 ($5.57B) from Mid-19 ($6.05B) = Spending was up $0.48B in 1st half of 2019.
- The over $150K group was the only group unaffected by the FDA grain free warning as spending grew consistently in both halves. If they had concerns about grain free, they apparently upgraded to even more expensive options.
- The over $100K groups and the under $30K group had the only annual increases. However, the under $30K group had their lift in the second half of 2018, which was very unusual. Their spending flattened in the first half of 2019.
- Besides the High Income pattern, there appear to be 2 other spending patterns based upon income. The Middle Income group, from $50K to $150K was most affected by the FDA warning with a spending drop in the second half of 2018. As income increased, the impact lessened until it was minimal at $100>150K. Spending rebounded very slightly in the first half of 2019 for all of these groups and the amount of the increase grew along with income.
- The Lower Income group, under $50K had almost the opposite pattern. They showed a spending increase in the last half of 2018, with the biggest increase coming from the <$30K group. In the first half of 2019, spending in the $30>$50K group fell -$0.78B, a huge drop. The <$30K spending was flat. However, this data suggests that the $50K income level is a key dividing point in Pet Food Spending behavior, at least in the era of Super Premium. It also demonstrates once again that analyzing pet food spending behavior is a complex process.
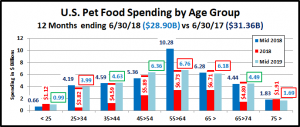
Now let’s look at Pet Food spending by Age Group.
- The 45>54 yr olds had the biggest 2019 1st half lift and were the only group with increased spending in both halves. They have the highest income, so it is to be expected that their behavior matches that of the $150K+ income group.
- Annual decreases occurred in 3 groups – 75+, 55>64, 25>34. However, the oldest and youngest (75+ & <25) had the only 2019 decreases and shared the same overall pattern. A 2018 2nd half lift followed by the drop in 2019 suggests that they were slower to act than other groups, first in upgrading food and then in reacting to the FDA warning.
- Although the 2019 lift was sometimes minor, all age groups from 25>64 spent more on Pet Food in the first half of 2019. This is a good sign for the second half of 2019.
That brings us to the obvious question, “What is happening in Pet Food spending at the start of 2019 across the whole range of demographic categories?” We will endeavor to answer that in our final chart. We will list the biggest $ moves, up and down by individual segments in 11 demographic categories.
The increase in the 1st half of 2019 was bland – up $0.05B but this bland result came from some tumultuous spending behavior…Always look deeper.
- There are big differences between the winner and loser in all categories but Area. You also see that the losers are often much bigger than the winners. The overall slight increase came from 44 of 80 segments (55%) spending more.
- You see the negative spending by the older groups reflected in the spending drops by these demographics – over 65, Retired, Homeowners w/o Mtge, Silent/Greatest Generations and $30>49K income. (Avg Retired income is $42.8K)
- In terms of positives, one thing immediately stands out. Thank God for Singles, especially if they are working. They had the biggest increase in 3 demographic categories. That’s unusual to say the least.
- Two “usual” winners are back on top – Homeowners w/Mtge and White, not Hispanic.
- Income matters, as is demonstrated by wins by $150K+ and the 45>54 yr olds, but education not as much. The winner was HS Grads, but all college educated groups, from Associates Degree to PHD also spent more on Pet Food.
- In Generations, the Millennials/Gen Z won. However, all but the very oldest groups spent more. Even the Boomers bounced back with a small $0.12B increase after a -$3.18B drop in the second half of 2018.
- Speaking of bouncing back, Blue Collar workers also started to recover after a bad second half of 2018.
- There are 2 “losers” that raise some concern – Married Couple Only and 1 earner, 2+ people CUs. Married Couples Only are a perennial winner but their share of Pet Food spending fell from 40% to 27%. 1 earner, 2+ CUs had a big lift in both halves of 2018. Perhaps their big 2019 decrease is also a delayed reaction to the FDA warning.
So, what will happen in the second half of 2019? It is a good sign that 55% of demographic segments are spending more in the first half of 2019 than they did in 2018. Also, Gen Xers, Millennials and even Boomers spent more so the increase is widespread. Considering these trends in conjunction with the big spending drop in the second half of 2018 a continued lift in the second half of 2019 is likely. However, there is another factor – inflation. Pet Food prices trended down from Mid-yr 2013 to Mid-yr 2018. Then they turned up and continued to increase through 2019. In the first half pet food prices were up 2.1% vs 2018. In the second half they were 3.6% higher. Will this impact spending? We don’t know. One thing is certain. We definitely need a new “must have” pet food trend.
The Pet Food segment continues to become more complex. In September, we’ll see what the 2nd half of 2019 brings.


