U.S. PET FOOD SPENDING $31.36B (↑$2.92B): MID-YEAR 2018 UPDATE
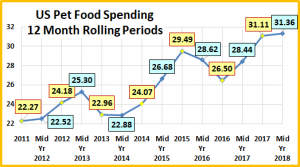
The US BLS just released their Mid-Year Update of the Consumer Expenditure Survey covering the period 7/1/2017 to 6/30/2018. The report shows Pet Food Annual Spending at $31.36B (Food & Treats). The following charts and observations were prepared from calculations based upon data from that report and earlier ones. The first chart will help put the $31.36B into historical perspective and truly show you the roller coaster ride that is Pet Food Spending.
Here are the current numbers:
- Mid 2018: $31.36B; ↑$2.92B (+10.2%) from Mid-17. The net +$2.92B in Mid 2018 came from:
- Jul>Dec 2017: Up $2.67B from 2016.
- Jan>Jun 2018: Up $0.25B from 2017
2017 was a great year for Pet Food Spending. The 1st half was up $1.94B and this trend grew stronger with a $2.67B increase in the 2nd half. However, the increase slowed markedly in the 1st half of 2018. We have noted in previous reports that Pet Food spending has been on a roller coaster since 2000, with 2 years up, followed by a flat or even declining year. This chart perfectly reflects this pattern since the recession driven, down year in 2010. This up and down “ride” has been driven by a succession of Food trends. 2011 saw the movement to “Natural” begin. This trend and spending increased through the 1st half of 2013. Then another change took place. The market had become much more competitive. Prices flattened out then began to fall in the 2nd half of 2013. Consumers began to look for value and they obviously found it as spending fell -$2.34B in the 2nd half, producing a net drop of -$1.22B for the year. 2013 was a game changer for this segment as it began an extended period of deflation which continued through 2018. Midway through 2018, Pet Food prices were still 2.3% lower than in 2013.
In the 2nd half of 2014 spending turned sharply up. This was the beginning of the movement to Super Premium which was initiated by the 25>34-year-old Millennials. In 2015 this trend took off, especially with the Boomers, as spending rose $5.4B. At the same time, the Pet Food spending of the 25>34 yr olds dropped. At first, we thought they had rolled back their upgrade. However, it turns out they were leading the way in another element of the trend to Super Premium – value shopping. For consumers, the Super Premium upgrade movement consisted of 3 stages:
- Trial – The consumer considers the benefits vs the high price and decides to try it out. Usually from a retail outlet.
- Commitment – After a period of time, the consumer is satisfied and is committed to the food.
- Value Shop – After commitment, the “driver” is to find a cheaper price! In today’s competitive market there are an increasing number of options. Some super premium brands are moving to the mass market. Retailers are developing super premium private label and of course, the internet has become a big player.
Now back to our timeline. After the big lift in 2015, those CU’s that upgraded went into “value shopping” mode and Pet Food spending fell -$2.99B in 2016, which was right on schedule with our timeline. However, the Super Premium cycle was not over yet. The benefits of the product along with the very price competitive market led to a much deeper demographic penetration of this trend and spending increased $4.61B in 2017. This huge lift immediately after a down year is very unusual. Usually the biggest lift occurs in 2nd year of the 3-year cycle. 2018 started off slowly with only a $0.25B increase. It most closely resembles the 1st half of 2012. If that pattern is true to form, then we can expect a $1+B increase in the 2nd half of 2018. Two patterns in our timeline graph support this expectation.
- Whether it is up or down, the 2nd half change is always greater than the change in the 1st
- In the last 3 years, the 2nd half trend has always mirrored the 1st There were no mid-year turnarounds.
Now we will take a closer look at the 2 most popular demographic measures – age and income. In the graphs that follow we will compare spending for the Mid-year 12 months ending 6/30/18 to the previous period. In our graphs we will also include the 2017 yearend $. This will also allow you to see the change in the 2nd half of 2017 and the 1st half of 2018.
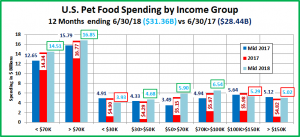
The first graph is Income, which has been shown to be the single most important factor in increased Pet Spending. Here’s how you get the change for each half using the $150K+ group as an example:
Mid-yr Total Spending Change: $5.02B – $5.12B = Down -$0.1B (Note green outline = increase; red outline = decrease)
- 2nd half of 2017: Subtract Mid-17 ($5.12B) from Total 2017 ($4.82B) = Spending was down -$0.3B in 2nd half of 2017.
- 1st half of 2018: Subtract Total 2017 ($4.82B) from Mid-18 ($5.02) = Spending was up $0.2B in 1st half of 2018.
- The over/under $70K groups have the same pattern – biggest lift in 2nd half of 2017; mini lift in 1st half of 2018
- The increase is being driven by the $30>100K group, but primarily by the middle income, $50>100K segments. The biggest lift is still in the 2nd half of 2017. However, the $50>100K group was up $1.32B in the 1st half of 2018. This is significant considering the total market was only up $0.25B in that time period.
- The change in the higher incomes is less pronounced. Both of these groups bought into Super Premium early. It looks like the $100>150K group is taking value shopping more seriously in 2018.
- The big drop in the spending in the 1st half by the <$30K is significant but somewhat deceptive. In the first half of 2017 this group had a big lift due to the Pet Food upgrade. By 2018 they were value shopping, but they had also lost 1 million CU’s. However, it gets even more complex. 1.5 million of the members of the group making $15>30K moved out and probably up in income. They spent over 25% more on Pet Food than the <$15K segment so this was a big loss. They were partially replaced by 0.5 million CU’s making under $15K but spending 40% less on Pet Food. The $0.97B drop is spending is significant, but it also demonstrates the complexity of pet food spending analysis.
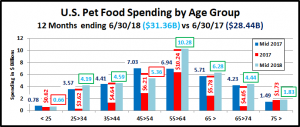
Now let’s look at Pet Food spending by Age Group.
- The only 2 segments with an overall decrease are the 45>54 year olds and the under 25 group. These decreases are related to the spending drops that we saw in the highest and lowest income groups.
- Quite frankly, the bulk of the 12-month lift was driven by the $3.3B spending increase by the 55>64 yr olds in the 2nd half of 2017. However, their spending flattened out in the 1st half of 2018.
- Starting out the new year, the biggest increases are coming from the 25>34 and over 65 age groups, while the 45>54 yr olds continue their downward move.
That brings us to the obvious question, “What is happening in Pet Food spending at the start of 2018 across the whole range of demographic categories?” We will endeavor to answer that in our final chart. We will list the biggest $ moves, up and down by individual segments in 11 demographic categories.
Remember the total increase in the 1st half of 2018 vs the same period in 2017 was pretty bland – up $0.25B. However, I think that you will see that this bland result came from some rather tumultuous spending behavior…Always look deeper.
- There are substantial differences between the winner and loser in all categories but Housing and Area. In Area the performers are those that you would expect. However, In Housing they are the opposite of the “norm”.
- In Race/Ethnic, White not Hispanic spending was down slightly. The biggest positive move came from the Hispanics. Their upgrade lift began in the middle of 2017. African Americans have entered the value shopping stage, after 18 months of gradual increases.
- The drop by Blue Collar workers and HS Grads with Some College comes after their upgrade commitment lift in 2017. Now, they are shopping for price and finding it.
- The Retirees are growing in numbers and obviously increasing their commitment to quality pet food.
- It just takes two. All Pet Spending increases sharply for married couples, especially when their only children are pets. The # of Earners also matters less in Food Spending, as long as you have 2 people.
- In the remaining groups we see related segments with similar positive performance in the 1st half of 2018. They are:
- 25>34-year olds. They’re all Millennials.
- Married Couples only are obviously 2 people CU’s with no children.
- The $50>69K income group within the 25>34 yr old segment are the most like to have no children.
- You can see the connection – 25>34 yr old married couples with no children and an income of $50>69K.
Why is the first half performance of this younger group important? Consider this: The 25>34-year-old Millennials led the way in the super premium food upgrade in the 2nd half of 2014. After becoming committed to their new high quality, high priced pet food, they then turned to value shopping and their spending dropped. This behavior was repeated by 2 waves of other segments as super premium made an ever-deeper penetration into the market.
Could the spending lift by this group indicate a new Pet Food trend? There are several possibilities “on the table”, including clean label transparency, customization, sustainability or maybe a combination. It is unlikely to cause a huge lift like super premium but could drive up spending in the 2nd half of 2018. There is one more indicator – the lift in the Advanced College Degree segment. This is another group that “buys in” early to scientific, nutritional improvements.
The Pet Food segment has become incredibly complex. We’ll see what the 2nd half of 2018 brings.


