GLOBAL PET EXPO 2019 – Wrapping it up!
Global Pet Expo 2019 is complete. Once again, it met and exceeded our expectations. In this report we’ll do a brief summary and take a look at some significant product category trends that we saw.
As you all know, the show is so huge that it has become somewhat of an endurance test for the 6500 buyer attendees. Here are the specifics:
- 360,000 Square feet of booth space – Up from 357.700 in 2018 (+0.6%)
- 1173 Separate Exhibitor Booths – Down from 1184 in 2018 (-0.9%)
- 307 sq ft – Avg Booth Size – Up 1.6% from 2018
- 319 1st Time exhibitors – Up from 301 in 2018 (6.0%)
The 10×20 size booth is still the most popular with 408 exhibitors but this is down 24 from 2018. The 10×20 size finished a strong second with 403, an increase of 14. However, the increase in the average booth size was driven by the group from 400 to 1500 square feet. There were 11 more booths in this range (+3.7%). The show has become so large, with over 5 miles of aisles, that an increased floor presence is becoming more needed to attract attendees. The industry depends on “new” to keep it vibrant and growing. The huge new product showcase and a strong presence of new exhibitors bodes well for the future.
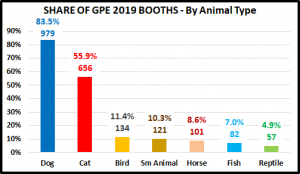
First, let’s look at the exhibitor product offerings by type of animal. The following chart shows the share of total booths that each animal had at GPE 2019.
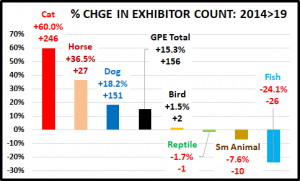
Dogs and Cats are obviously the royalty of the industry, but “Dogs Rule”. In fact, 5 out of 6 exhibitors are selling Dog products, while only 1 in 20 offers aquatic products. That’s quite a disparity. The chart shows where we are now, but it raises the obvious question, “Where have we come from?”. The following chart shows the change in exhibitor count by animal type from 2014 to 2019. For comparison purposes, it is ranked by percent change in the number of exhibitors. During this period the total GPE exhibitor booth count increased by 15.3%. Any animal type without at least a 15.3% increase in exhibitors lost share.
- Dogs may “rule”, but they had better watch their back. Cat products have by far the biggest growth of any animal type in both numbers and percentage.
- Only Cat, Horse and Dog products are gaining in share of exhibitors. All other animals are losing ground.
- The Fish products group is especially concerning with a 24% drop in the number of booths offering aquatic products.
- While mergers and acquisitions are definitely a factor, the number of exhibitors with products for the smaller “all other” animals is not growing.
Now, let’s take a closer look at the “Pet Royalty” – Dog & Cat Products. They truly are royalty and pervasive across the show floor. In fact, 1022 of the 1173 GPE exhibitors (87%) offered dog and/or cat products. Which product categories have shown the biggest growth in exhibitors since 2014? To answer this question, I ranked the 32 categories on my SuperSearch tool by 3 different criteria:
- Increase in # of exhibitors
- % increase in exhibitors
- Biggest gain in booth share
I combined and averaged the rankings and came up with the 12 biggest gainers in Dog & Cat Product Categories. There were other good performers but the “Dandy Dozen” in the chart below are the most outstanding. They are ranked by the increase in exhibitors offering products in the category.
In terms of these individual categories, the first thing that stands out is the truly amazing performance by the OTC Meds, Supplements and Therapeutic Devices. From 2014 to 2019 this category moved up from #6 to #2 in the total exhibitor count rankings. To put this into even better perspective, the increase of 140 exhibitors is greater than the total exhibitor count for all but 7 of the 32 dog & cat categories. Driven by the increased concern for the health and well being of their pet children and rapidly increasing Veterinary Services prices, this movement to self-medication is perhaps the biggest current trend in the industry. Another “symptom” of this condition has been the deep demographic penetration of the high nutrition, super premium foods. The influence of this category has also spilled over into other categories, like treats, as supplements are often given in treat form as well as certain wipes and dental products.
Other categories can also be bundled together to show a larger overall trend. Pet Parents are also concerned about the “outside” appearance of their pets. There are an increasing number of retail outlets that offer grooming services, but some consumers want to “do it themselves”. This is demonstrated by the strong performance by Grooming Tools, Shampoos and Wipes.
Another bundle deals with waste and cleanup. The 4 categories in this group are Waste Pickup (mainly poop bags), Stain, Odor & Cleaners, Litter Accessories and Training Pads/Diapers.
Cat products overall have had tremendous growth. They earned a share of the Toy category, but they are the biggest driver in Furniture and of course, Litter Accessories.
There is still room for some fun as Toys have had a big increase and of course many Doggie Dental Products are in the form of chew toys. Another fun category is Treats. Most Treats are not medications, they are primarily rewards. The Treat Category has remained firmly in the Number 1 spot for most exhibitors since 2014. In fact, they are 118 exhibitors ahead of second place, Meds & Supplements.
There is one other category that we should note, but it is not strictly in the product categories. It is a specific type of Exhibitor – Business Services. These exhibitors are not in the business of providing branded products for resale. They provide things like POS Services, Store Design and Fixturing, Grooming Equipment and Supplies for professionals and Private Label products. In today’s incredibly competitive world, retailers of all sizes are looking for ways to improve the efficiency of their business, offer 1 stop shopping, which includes pet services to broaden their consumer appeal and private label products that can differentiate them from the competition. There were 8 exhibitors in this classification at GPE 2014. In 2019 there were 71. That’s an increase of 63 (+778%). That’s a pretty strong trend.
As I look back at the winners listed in this report, I see 2 truly major trends since 2014 – The Wellness Products Trend which is illustrated by the growth of OTC Medications, Supplements and Therapeutic Devices and the amazing growth in the number of exhibitors offering Business Services. The spectacular performance by these 2 groups reflects both the needs and wants of consumers and the business needs of the attendees.


