2015 U.S. VETERINARY SPENDING $17.1B…DOWN ↓$0.5B
Veterinary Services is the second largest Pet Industry segment. A high inflation rate has put spending on a rollercoaster ride with today’s more price sensitive consumers. In 2015, spending was $17.11B – down -$0.47B (-2.7%) from 2014. In this report, we’ll try to determine the demographic drivers of the decrease. (Note: All numbers in this report come from or are calculated by using data from the US BLS Consumer Expenditure Surveys)
Veterinary Spending per H/H in 2015 was $133.44, down from $138.72 in 2014. (Note: A 2015 Pet H/H (65%) Spent $205.29) More specifically, the decrease in total spending came as a result of:
- 2% more H/H’s
- Spending 0.9% less $
- …2.9% less often
We’ll need to take a closer look. But first, the chart below gives an overview of recent Veterinary Spending.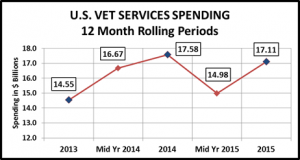
You can see the rollercoaster. The $2.1B “lift” in the second half was not enough to overcome the precipitous $2.6B drop in spending that occurred in the first half of 2015. Let’s look at spending by Income group.
Observations
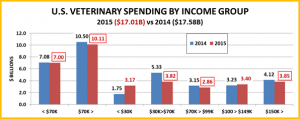
- <$70K & >$70K – Both were negative. However, the drop was larger in the higher income group.
- <$30K (32% of H/H’s) – Up $1.42B (+81.3%). This was a huge increase and a great comeback from a -$1.0B drop from 2013 to 2014. This group is a “mixed bag” with a lot of people just getting started and retirees.
- $30K to $100K – (46.5% of H/H’s) – Down -$1.8B (-21.2%). As we have seen, this is a price sensitive group. The $30K to $70K group had a $1.7B increase in Food and the $70K>$100K group spent less in all segments.
- >$100K (21.5% of H/Hs) Down -$0.1B (-1.3%) Bought $2.3B more food, but only $150K> spent less on Vet.
Next, Veterinary Spending by Age Group
Observations
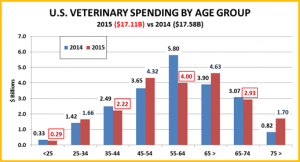
- <25 (5.9% of H/Hs) –Down $0.04B (-12.8%) They bought a lot more food but less in all other segments.
- 25>34 (16.4% of H/Hs) -Up $0.24B (+16.9%) Spent much less on products but more on services.
- 7% more H/Hs
- Spent 2.1% more $
- …11.6% more often
- 35>44 (16.8% of H/H’s) –Down $0.27B (-10.7%) Price vs convenience – only increased on Non-Vet services
- 8% fewer H/Hs
- Spent 1.7% more $
- …10.5% less often
- 45>54 (18.9% of H/Hs) -Up $0.67B (+18.2%) Here’s how the wealthiest group spent their Veterinary $$..
- 4% fewer H/Hs
- Spent 18.3% more $
- …1.1% more often
- 55>74 (32.3% of H/Hs) –Down $1.94B (-28.1%) Spent $6B more Food. The key is the 55-64 group with…
- 6% more H/Hs
- Spent 21.7% less $
- …15.9% less often
- 75> (9.8% of H/Hs) -Up $0.88B (106.3%) Any doubts about their commitment to pets? Look right here!
Here are some key Demographic “Movers” in Veterinary Spending. Take a look then we’ll wrap it up.
Summary
The H/Hs that bought more are in 2 groups – the oldest Americans, many are retired and have paid off their home, but make less than $30K and the $100>$150K income group – Both with only 1 or 2 in their H/H.
The drop in Veterinary Spending comes largely from “Middle America” – H/Hs with incomes from $50>$100K, married couples, 2 earners who work as managers or professionals, homeowners with a mortgage, living in a city or suburb . These are the some of the biggest spending demographic groups in the entire Pet industry. However, these consumers who have bought the most in the past, cut their Veterinary spending in 2015.
The single demographic segment most responsible for the overall decline in Veterinary Spending was the 55-64 age group, with a $1.8B decrease. The $5B increase in Pet Food Spending by these “Boomers” had to be a big factor in this decision to cut back. Without such a huge drop in this one segment, Veterinary sales would be up. However, you can’t ignore the fact that a continuing high inflation rate affects the spending of today’s value (price) conscious consumers across a wide spectrum of demographics.

