Pet Prices Update: 2015 vs 2014 – Not a good second half!
In December all Segments were up slightly, but that doesn’t tell the story of what has been a crazy year. Of course prices in the Service Segments, especially Veterinary consistently moved up. It’s the Food and Supply Segments, which account for 63% of the Industry’s business, that are the real story in 2015.
Of course, all the hard data is included in the report. However the CPI story, which includes all-time record setting drops in both Supplies and Food is best told visually. You need to see it to believe it. First…The Data
DECEMBER PET CPI SPECIFICS
Veterinary Services
- Dec – Up ↑ 0.37% (slightly more than 2014 when Dec went Up ↑ 0.14%)
- Since Dec 2014: Up ↑4.56%
NonVet Services
- Dec – Up↑ 0.15% (A turnaround from 2014 when Dec was Down↓ 0.01%)
- Since Dec 2014: Up ↑3.12%
Pet Food
- Dec- Up ↑0.23%% (Slightly more than 2014 when Dec went Up ↑0.1%)
- Since Dec 14: Down ↓-1.52%…Big!
Pets & Pet Supplies
- Dec- Up ↑0.21% (slightly more than 2014 when Dec went Up 0.09)
- Since Dec 14:↓-2.35%…huge drop!!
Total Pet
- Dec – Up↑ 0.22% (Last year Dec went Up ↑0.14% – All segments are moderately up.)
- Since Dec 2014: Up ↑0.44% – Strong Inflation + Strong Deflation = Moderation
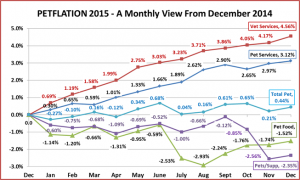
Here’s a monthly “visual” of 2015 so you can see “the storm” before a calm December
- The Service segments basically continued their upward pricing spiral in 2015.
- The year in Food & Supplies started off with a larger than normal Drop in January. However, December was the pricing peak in 2014, rather than November, so this contributed to the size of the decrease.
- Food prices were moderately up and down until July brought a record drop which continued into August. Prices began a gradual recovery in the Fall but are still down 1.5% for the year.
- Supplies had a similar pattern to Food but waited until September to begin a record 2 month plunge.
- Take special note of how “calm” Total Pet is…never more than 0.68% above or -0.27% below Dec 14.
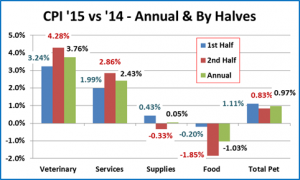
The chart below compares the Annual CPI Change from 2014 to 2015 as well as for the 1st and 2nd halves.
- The inflation in the Service segments strongly accelerated in the second half…Vet +32, Services +43%.
- The Supply Segment was looking to turnaround deflation…then the 2nd half.. a huge drop… a flat year.
- Food was down slightly at -0.2%…then a record drop in the 2nd half led to the worse CPI year…ever.
- I think you see where the title of this article came from, “Not a good 2nd Half”…an understatement!
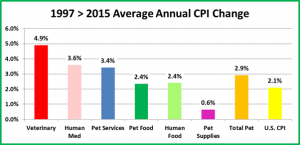
Next we’ll put the CPI numbers into a “historical” and market perspective. The following chart shows the average annual rate of change in the CPI from 1997 to 2015 for each of the Pet industry segments, Total Pet…and some comparable product groups and industries.
- Veterinary leads them all in CPI increase – 36% faster than Human Medical services. Of note: A veterinary service that cost $100 in 1997 cost $236 in 2015 – a 136% increase in prices. Services are also high at 3.4%.
- On the other hand, the price increase in Pet Food over 18 years almost exactly matches the CPI increase of Human Food served at home. From an overview, Pet Food pricing seems to be on target.
- Pet Supplies are a different story. They have increased at an annual rate of only 0.6%. That means that the total increase in supply prices over 18 year is only 13.6%, amazingly low.
- Driven by the Service Segments, Total Pet has increased prices 38% faster than the overall U.S. CPI.
The Pet Industry CPI increase from 1997 to 2015, except for the Vets, seems reasonable. Let’s look deeper!
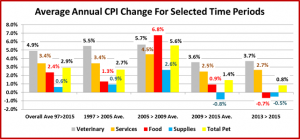
As I reviewed the CPI records, logical divisions in time seemed to stand out. The next chart shows the average annual rate of change in CPI for each Industry Segment. Note: I also included the Overall Average from 97>15
- 1997>2005 – “The Early Years” – Veterinary prices were increasing at an extraordinary rate and services were at what turned out to be their average inflation rate for 18 years. With annual increases of 0.9% for Supplies and 1.3% for Food, these 2 segments were in the “sweet spot”…and almost all the strong revenue growth in these segments over these years was real…not price increases.
- 2005>2009 – “The Big Short” – The already high inflation rate in the Service segments increased slightly but in the product segments, it skyrocketed. The rate of increase in supplies was 2.6%, not too bad. However, it was triple the rate of the earlier years. The rate for Pet Food increased 400+% to 6.8%. Prices for food increased a total of 29.9% in just 4 years. Together the segments generated an annual rate for Total Pet of 5.6%. Most of the Industry’s revenue growth in this period was simply from price increases. However, the really bad thing was the timing…up to and through the heart of the great recession.
- 2009>2015 – “The Recovery” – The buying behavior of U.S. consumers changed forever. “Value” became the #1 priority in virtually all purchases. Price now mattered…a lot. All segments, even Services took a step back in price increases. Food prices were up and down, but the overall rate is the lowest in history. Supply Prices reached their peak in September 2009 and have basically been deflating ever since. Competition in the product segments became even fiercer. When low retail price becomes a top priority, consumers benefit but profit suffers, affecting everyone in the distribution channel. Revenue increases, especially in the Vet segment became increasingly dependent on higher income groups. The CPI rate for Total Pet dropped 75% to 1.4%.
- 2013>2015 – “What’s Happening Now?” Amazingly, the Service Segment rates are inching up again. Vet prices in December 15 are up 4.6% from a year ago. Products are a different Story. Food Prices have been deflating since 2013, with a record drop in 2014. Supplies prices dropped 1.1% in 2014. 2015 was poised for a deflation turnaround year…then came the Fall…literally. Prices fell almost 2.5% between September and November. The result…prices flat for the year…better than a drop, but not what this segment needed. Total Pet CPI is a little low at 0.8% and is being generated by 2 negative situations.
- 2016> – “What’s Next?” Prices affect the U.S. consumer. Strong inflation can depress sales. Necessary expenditures, like Veterinary Services, can become “discretionary” and are put off or eliminated, especially by demographic groups with lower incomes. Although revenues may increase, consumers may be paying more, but buying less. Deflation can be even a bigger problem. For necessary items, like Food, reduced prices don’t generate increased purchases. Consumers just spend less. It can spur increases in discretionary spending but with today’s well informed consumer, you better make sure it is a great value – it needs to be better.
We’ll take a look at the CPI for the first quarter of 2016 when March numbers are released in April.


