All aspects of the world are constantly changing. The Retail Marketplace is no exception as retailers try to meet the evolving wants and needs of consumers. When I was growing up, Traditional Department Stores and Brand-named products “ruled” the Retail Market. Now, the focus is on value (quality + price) and convenience so the Internet and the big “1 stop shopping” outlets like Warehouse Clubs, SuperCenters and Home Centers dominate the market. Plus, even smaller chain stores now offer a variety of private label products.
Total Retail grew from $2.0T in 1992 to $8.3T in 2023, a 312% increase – over 4 times more $ were spent. In this report we will try to identify the specific changes in the Retail Market from 1992 to 2023 that drove the increase. Some channels rose to prominence while others fell. The primary source of the data is the Census Bureau’s Monthly Retail Trade Report. This evolution report is long and complex. We will start with the Big Retail Groups then ultimately drill down to the individual channel level. The final results are relatively simple but the journey to our goal is very complicated. To make it easier for you to understand, I have created and included 38 graphs and charts so you can literally “see” the details of the 1992>2023 Retail Evolution. It will also reduce the amount of comments. We should also note that the data is in actual $. Inflation can certainly impact consumer spending, but we will focus on the amount spent. FYI – The CPI increased 117% from 1992>2023 and Commodities prices grew by 73.1% so Total Retail only had a 138% lift in the amount of product sold 92>23. Services were the overwhelming “leader” in raising prices – +153%.
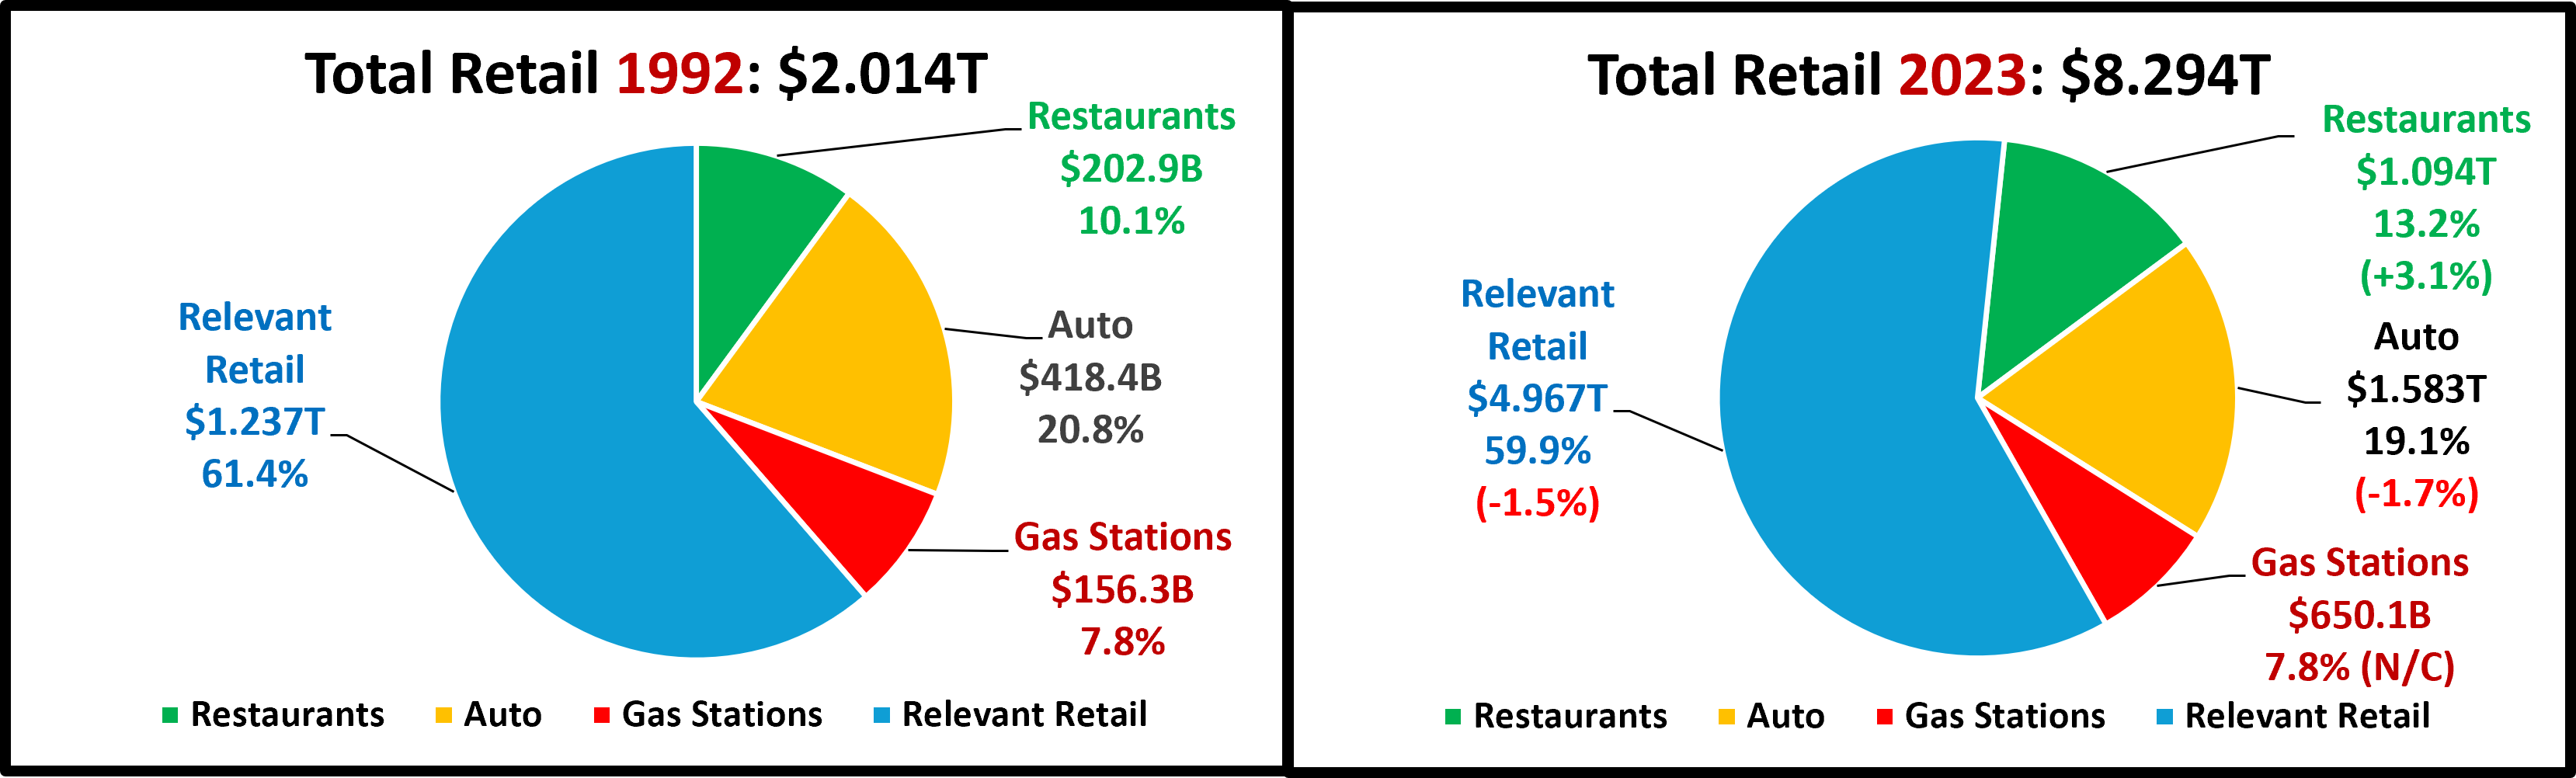
Let’s get started. Our first two pie charts show the Total Retail market share for the Big Groups – Restaurants, Auto, Gas Stations and Relevant Retail in 1992 and 2023.

The 2 charts look very similar. There was no change in share for Gas Stations. Restaurants were the only group to gain share, +3.1%. I’m sure that a 150+% increase in prices was a big factor. The Auto group lost -1.7% but the big surprise was Relevant Retail losing -1.5%. They are now 59.9% but still slightly above their 92>23 average of 59.8%. This is rather calm. Let’s look at the cumulative growth by year in a line graph.

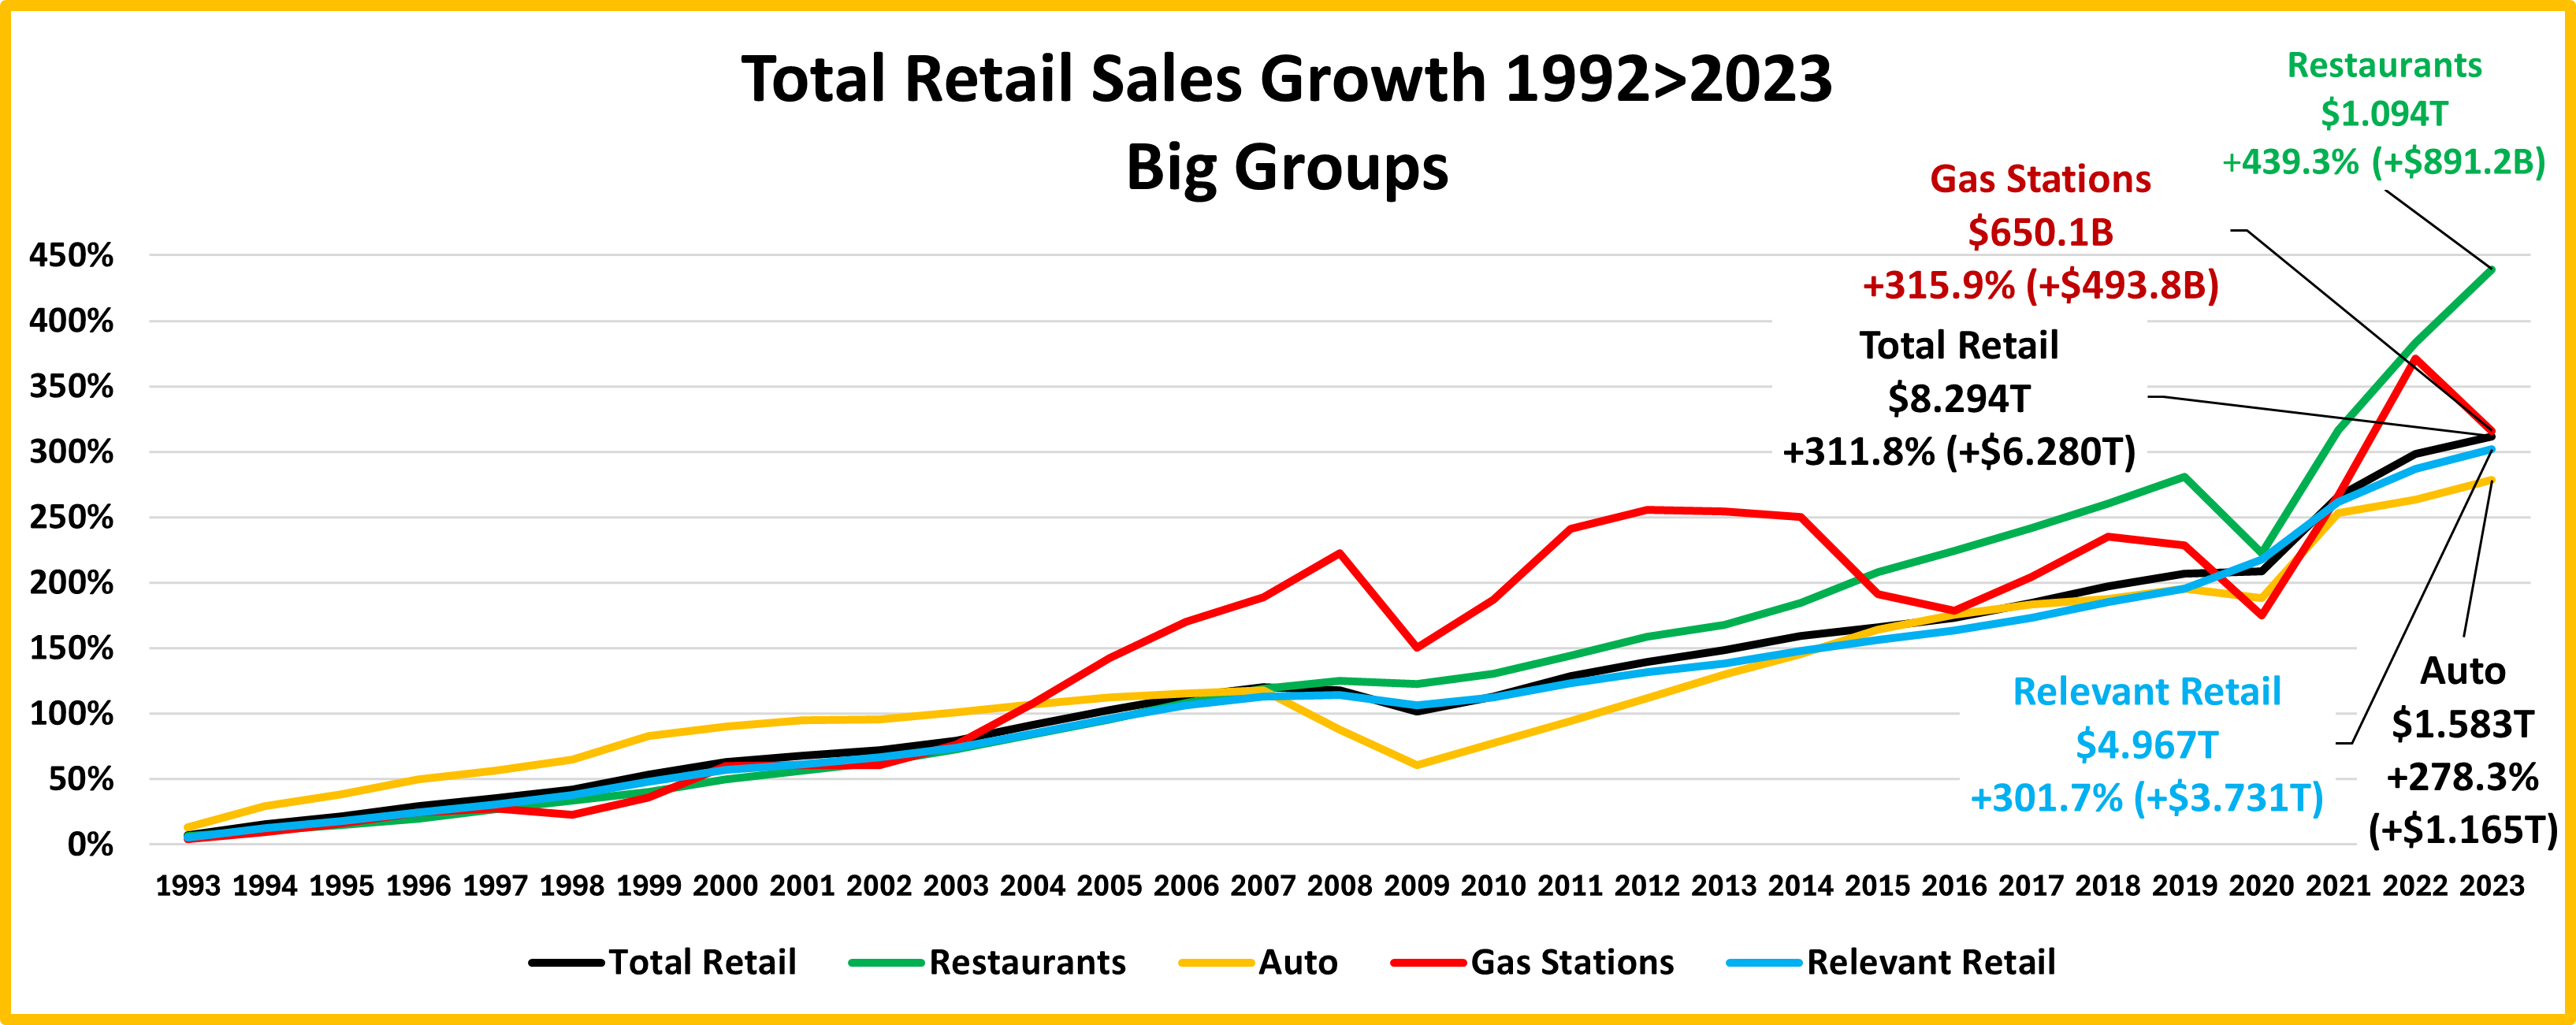
The first thing that you notice is that there are 2 big negative events – the Great Recession which hit bottom in 2009 and the 2020 Pandemic. The Recession drove sales down in all big groups. Auto was actually down in both 2008 & 2009. Their drop in 2008 was large enough to drive Total Retail down for that year too. Auto didn’t return to the sales level of 2007 until 2013. Gas Stations had a huge drop in 2009 but they recovered by 2011. Relevant Retail had a small drop. They almost recovered in 2010 but didn’t officially exceed 2008 sales until 2011. BTW, this was their only annual sales decrease since 1992. Restaurants had a miniscule drop and were back on track in 2010. As noted, sales in Total Retail were down in both 2008 & 2009. They fully recovered in 2011.
Now, the 2020 Pandemic. Sales decreased in Restaurants, Auto and Gas Stations but the lift in Relevant Retail was large enough to keep Total Retail slightly positive. Due to the “stay at home” attitude, the drops in Restaurants and Gas Stations were huge but all groups had recovered by 2021. Here are some 1992>2023 specifics.
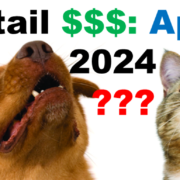
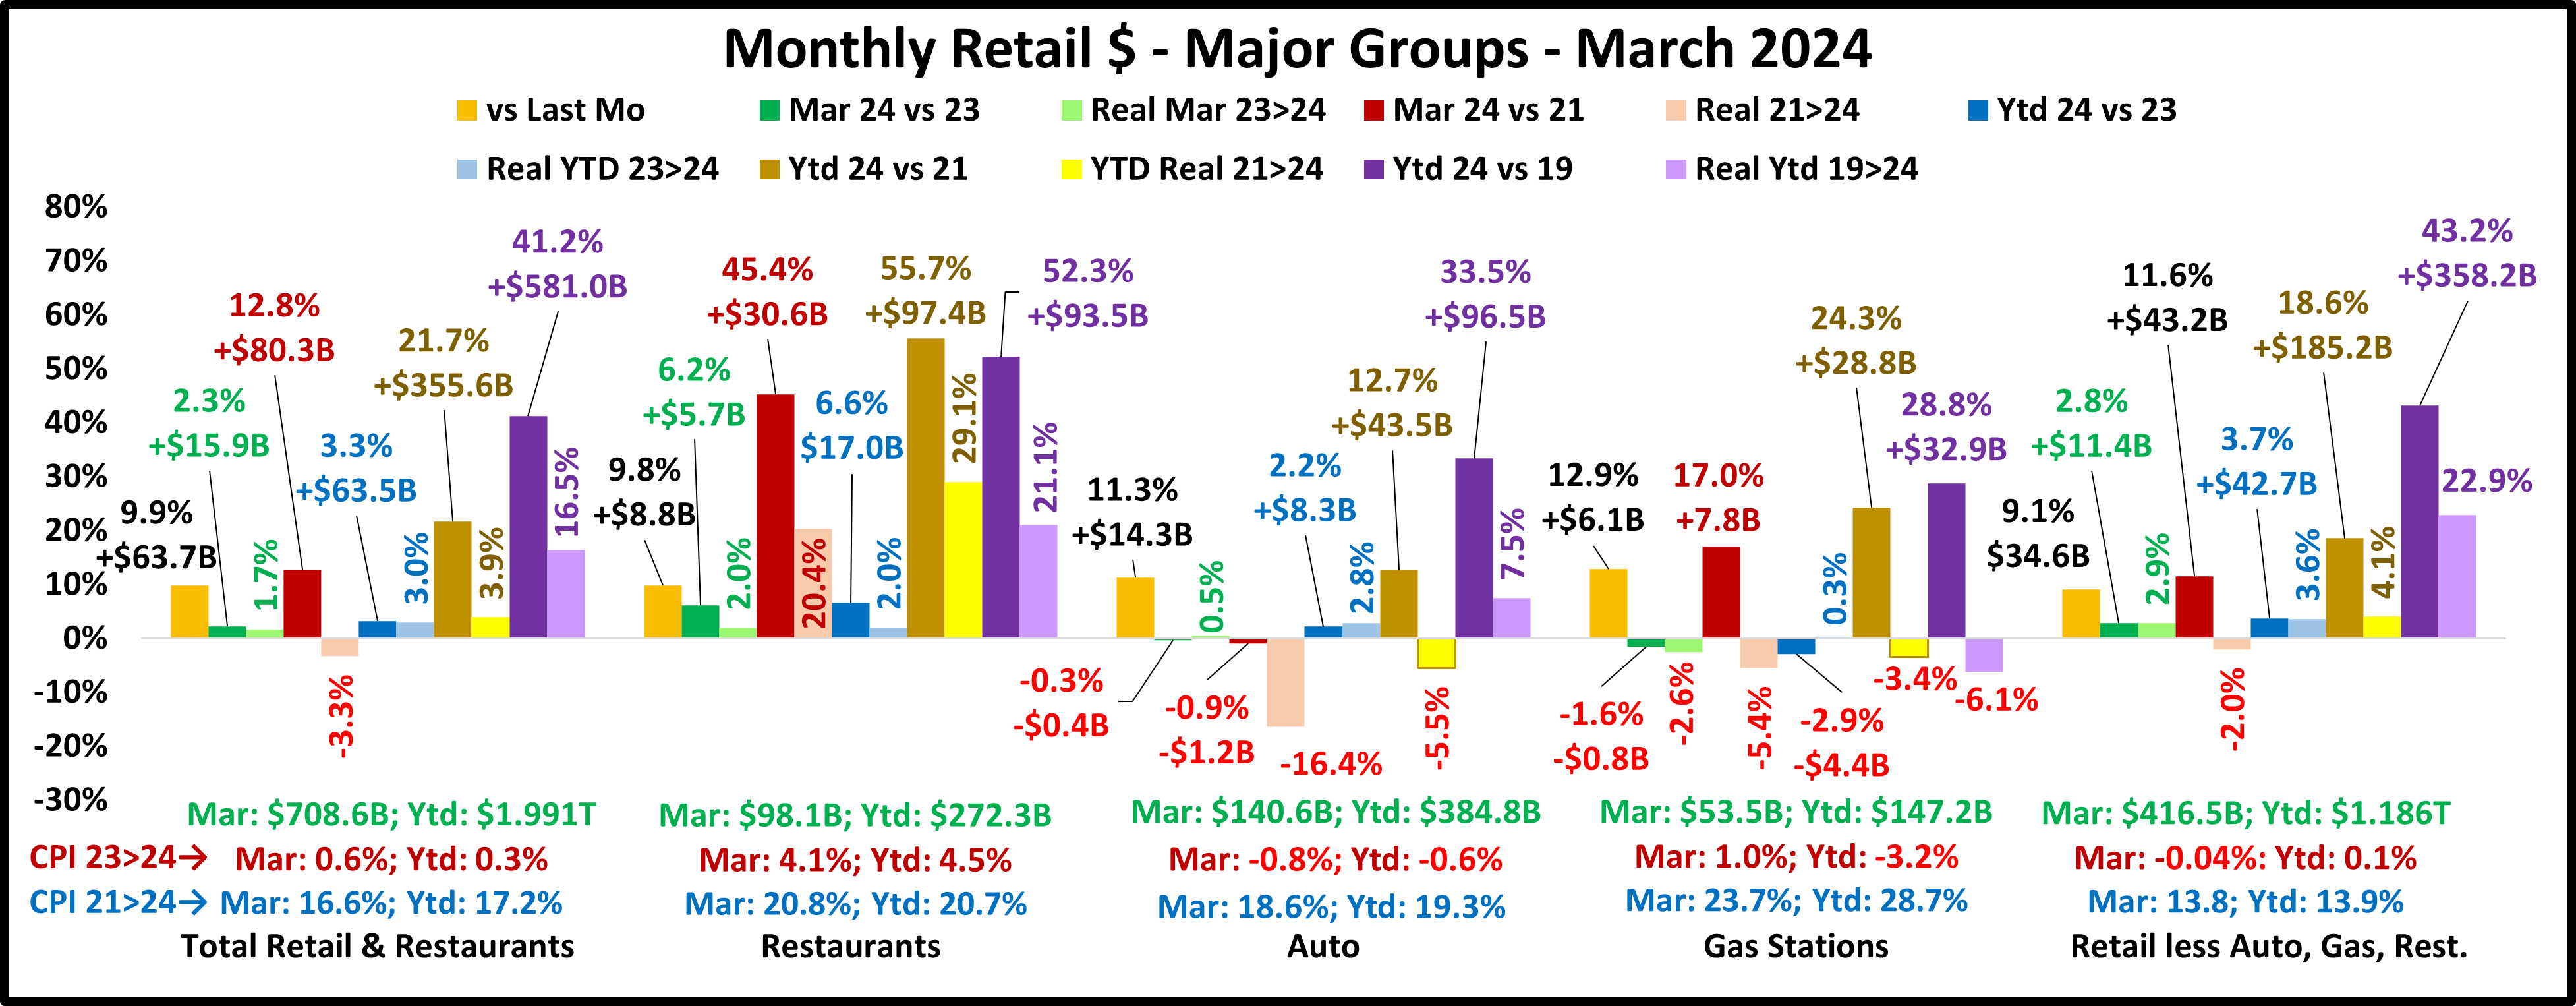
Total Retail – 2023 sales = $8.294T; growth from 1992: +$6.280T (+311.8%); avg growth: +4.6%. They only had 2 annual decreases, in 2008 & 2009. The biggest drop was -7.4% in 2009. Their biggest lift was +18.4% in 2021.
Restaurants – 2023 sales = $1.094T; growth from 1992: +$891.2B (+493.3%); avg growth: +5.6%. They also have had only 2 drops, in 2009 & 2020. The biggest drop was -15.3% in 2020. Their biggest increase was +29.1% in 2021.
Auto – 2023 sales = $1.583T; growth from 1992: +$1.165T (+278.3%); avg growth: +4.4%. They have had 3 down years, in 2008, 2009 & 2020. The worst was -14.5% in 2009. Their best year was +22.5% in 2021.
Gas Stations – 2023 sales = $650.1B; growth from 1992: +$493.8B (+315.9%); avg growth: +4.7%. As you can see on the chart, their sales have been on an up/down roller coaster ride for the last 20 years. Interestingly enough, in 2023 they are at about the same level as they would have been if they had just maintained their 1992>2003 growth rate. They’ve had 10 down years, the worst was -22.3% in 2009 but 4 drops, including 23 were over 10%. Their best year was +33.4% in 2021 but 10 were in double digits. Prices are up 216% since 1992, with big fluctuations, which explains the rollercoaster.
Relevant Retail (Less Restaurants, Auto & Gas) – 2023 sales = $4.967T; growth from 1992: +$3.731T (+301.7%); avg growth: +4.6%. As we noted, their only down year was 2009, -3.6%. In fact, they only had one other year below +2.0% – +0.5% in 2008. Their best year was +13.7% in 2021 and was the only year that their increase exceeded 10%. They are the epitome of consistency. Their share of Total Retail has been 59>59.9% in all but 7 years. In those years, it ranged from 60.2% in 2008 to 63.2% in 2020. Two of the 60+ years were 1992>93 at the start of our analysis, but five – 2008>10 & 2020>21 occurred when the country was in crisis. Relevant Retail includes a variety of channels that often have a radically different reaction to trends and outside influences. However, they always manage to “unite” to produce consistent growth for this big group.
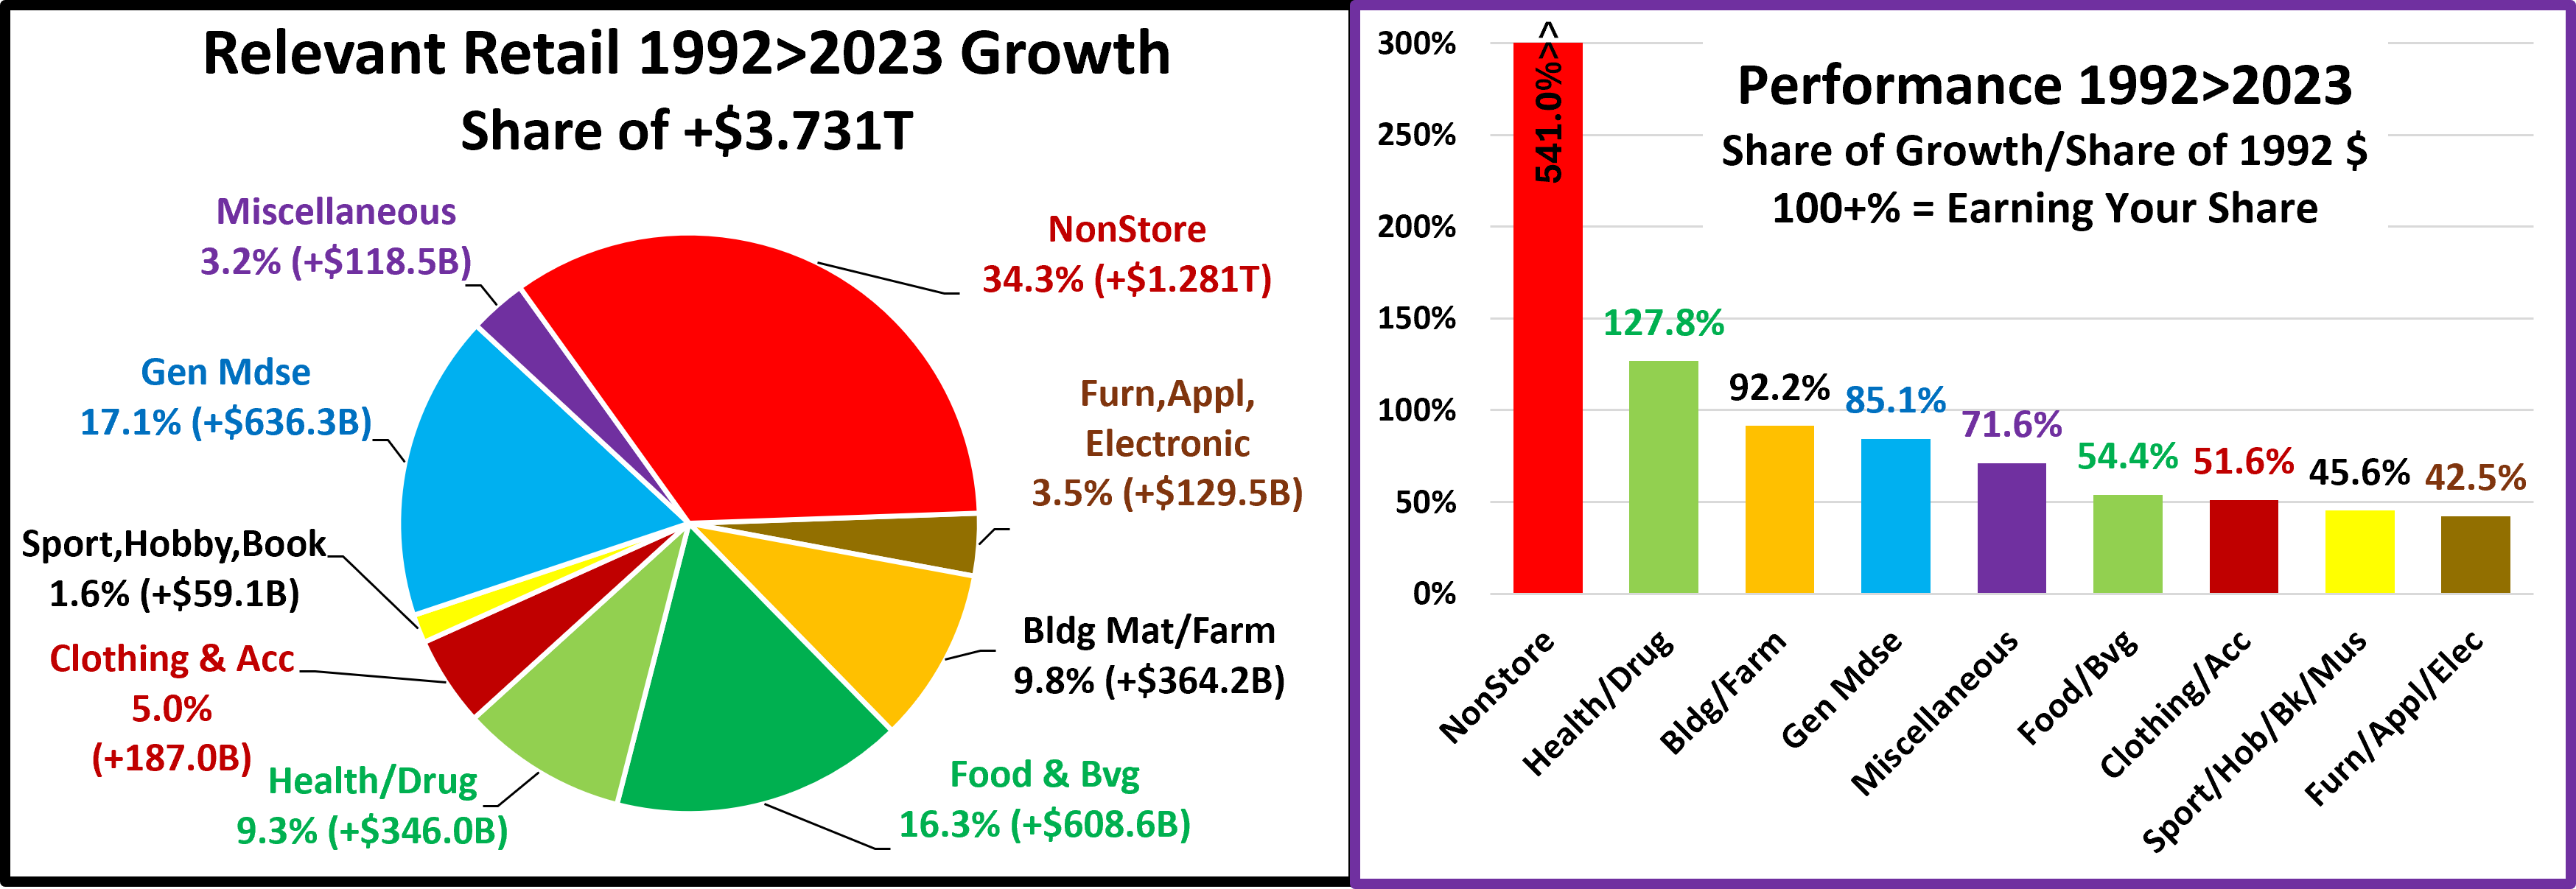
In our next analytical step, we will begin to drill down into Relevant Retail to see the specifics behind the consistent growth in the largest member of the Big Groups. It is the area of most interest to the CPG industry. We start with pie charts showing the 1992 & 2023 share of dollars of the large channel Subgroups.

Unlike Total Pet, you immediately see a major difference in the 2 charts. With a 21.1% increase in share, NonStore moved up from #7 to #1. All other subgroups but Health & Drug loss share. The biggest decrease was -10.3% by Food & Beverage, the former leader. The smallest drop was -0.6% by Building Materials/Farm. Obviously, this deserves a closer look. We will turn to line charts covering 1992>2023 sales. To make them easier to read, they are divided into 3 groups based on the % size of their 92>23 increase. We will start with the lowest performers and work our way to the top.
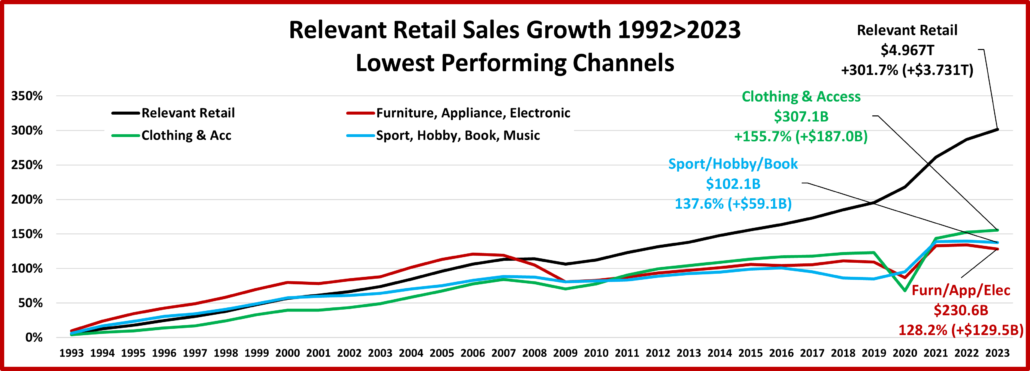
With some slight variations, all 3 had a very similar pattern. They also more than doubled their sales but that was significantly below the overall quadrupling by Relevant Retail.
Furniture, Appliances & Electronics – $230.6B; +$129.5B (+128.2%); avg: +2.7%. They had the biggest Recession drop, -17.5% which started in 2008. They actually didn’t recover to the 2007 level until the 24.9% lift in 2021, after the 2020, -10.8% COVID drop.
Sport, Book, Hobby, Music – $102.1B; +59.1B (+137.6%); avg: +2.8%. They had the smallest Recession drop and sales were down before COVID. They actually grew in 2020. Worst year: 2018 (-4.7%); Best year: 2021 (+22.5%).
Clothing & Access – $307.1B; +$187.0B (+155.7%); avg: +3.1%. They had drops in 2008>09 & 2020 but quickly recovered. Worst year: 2020 (-24.8%); Best year 2021 (+45.1%).
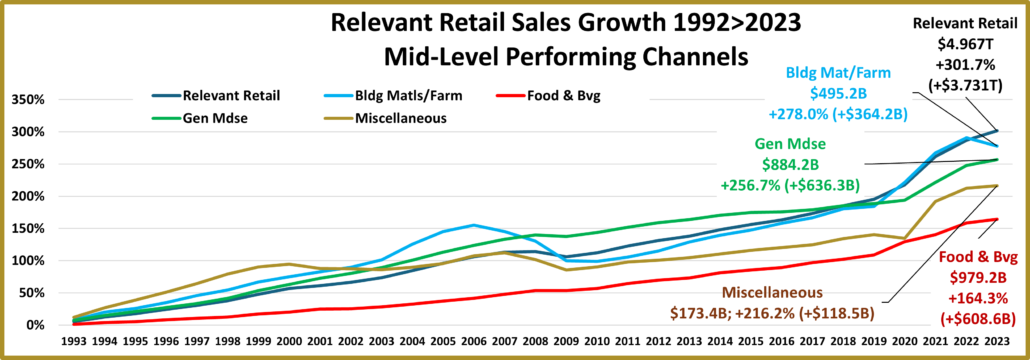
You see some distinct differences in the patterns of this mid-level group. While their 1992>2023 increases were all below Relevant Retail, all Subgroups except Food & Beverage at least tripled their sales vs 1992.
Food & Beverage – $979.2B; +$608.6B (+164.3%); avg: +3.2%. They have had relatively low growth, but it has been very consistent. They had only 1 down year, 2009 and the drop was small, -0.2%. Their biggest lift was +9.3% in 2020. Their growth accelerated from 2020>2023. This was primarily due to 2 factors – the move to eat at home and strong inflation.
Miscellaneous Stores (includes Pet) – $173.4B; +$118.5B (+216.2%); avg: +3.8%. They had drops in 2001>03, 2008>09 & 2020. The biggest decrease was -8.1% in 2009 and they didn’t recover to the 2007 level until 2015. The 2020 drop was a different story. They recovered immediately in 2021 with the biggest lift in history, +24.2%. This was their first double digit lift since +12.9% in 1994. Growth slowed markedly to +1.2% in 2023.
General Mdse – $884.2B; +$636.3B (+256.7%); avg: +4.2%. Although their growth is bigger, they have a pattern very similar to Food & Bvg. They have only 1 drop. It also occurred in 2009 and was minor, -1.0%. They also had no double digit increases but their biggest lift was in 2021, +9.4%, not 2020 and their growth after COVID was a little stronger.
Building Material/Farm – $495.2B; +$364.2B (+278.0%); avg: +4.4%. Their pattern was very different. Sales fell from 2007 through 2010 and also in 2023. The biggest drop was -13.3% in 2009. Plus, their growth accelerated in 2020 and continued through 2022. The biggest lift was +14.3% in 2021 but 2020 was 2nd with +13.0%. Now, the top performers…
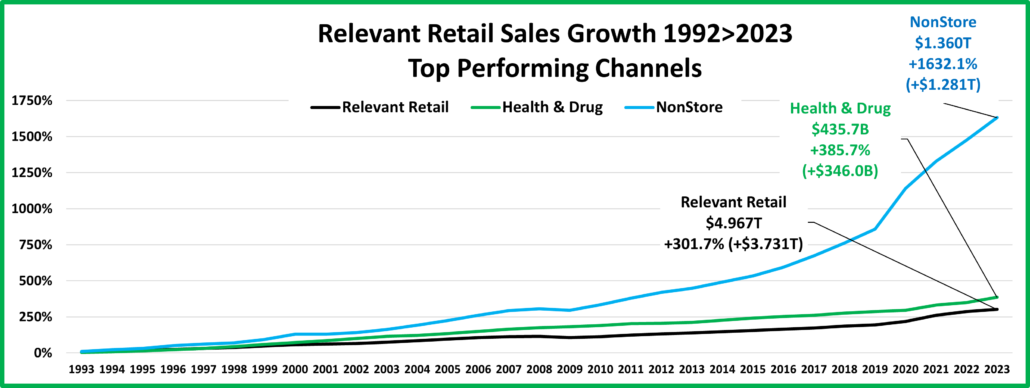
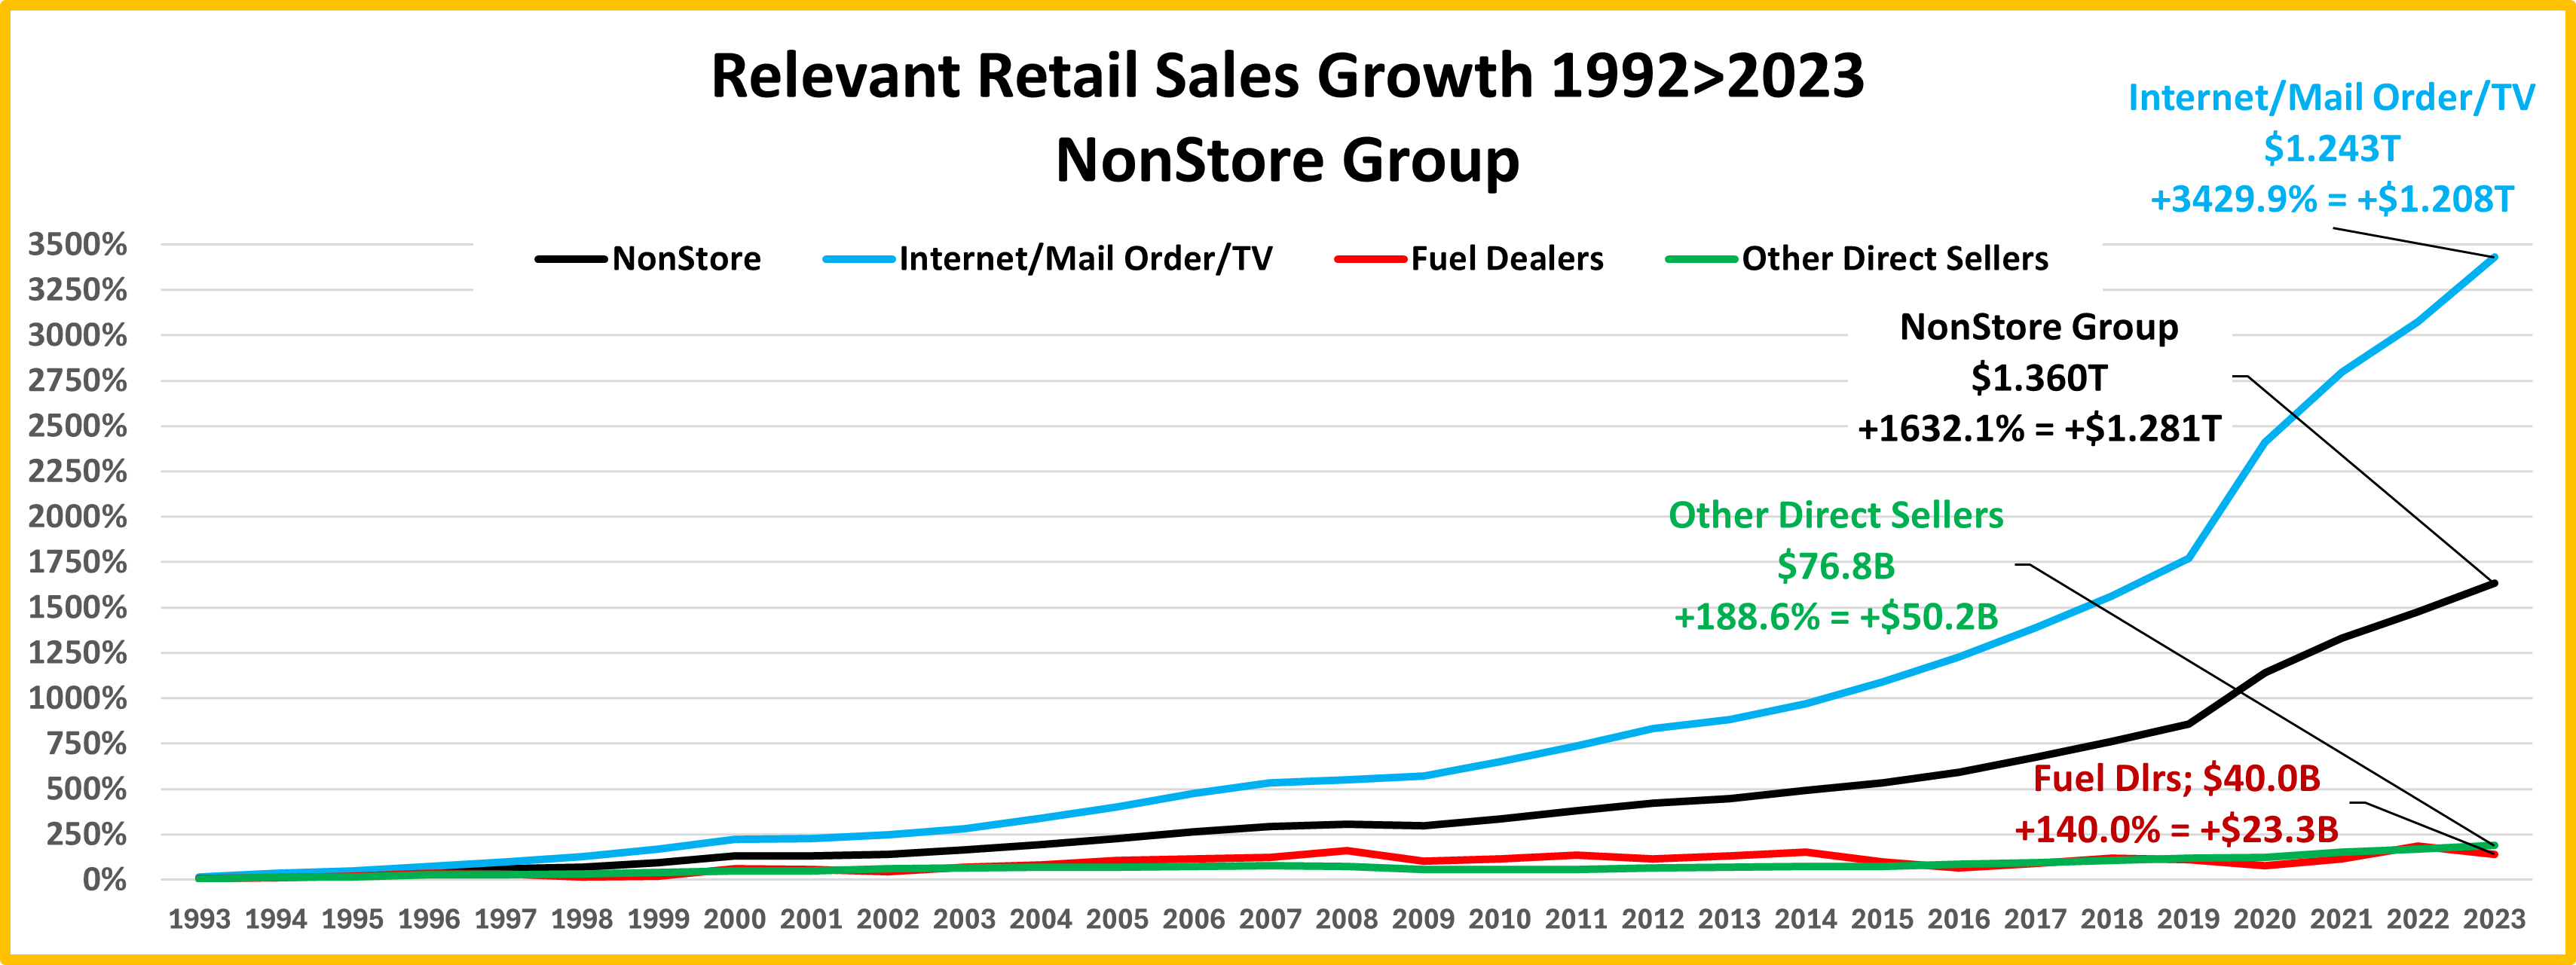
As you can see, there were only 2 Subgroups whose growth exceeded Relevant Retail – Health/Drug & NonStore. While Health/Drug had consistent growth, NonStore accelerated in 2010 and then skyrocketed in 2020.
Health & Drug – $435.7B; +$346.0B (+385.7%); avg: +5.2%. Their growth was definitely consistent as they were the only Subgroup with no decreases in sales. Their smallest lift was +0.9% in 2012. They only had 1 double digit increase, +10.1% in 1999. Sales did increase +9.0% in 2021 & +8.1% in 2023 but their strongest growth was 1996>2003 – avg: +8.3%.
NonStore – $1.360T; +$1.281T (+1632.1%); avg: +9.6%. Their spectacular growth is obviously being driven by the internet. They did have 1 down year, -2.5% in 2009. Sales took off in 2010 then exploded with a 29.3% lift in 2020. Every year 2017>2023 had a double-digit increase. Consumers seek value & convenience, which is the internet game plan.
The next pie chart shows each Subgroup’s share of Relevant Retail’s total growth. If you divide the share of growth by the share of 1992 sales you get a measure of performance. The bar graph allows you to compare the results.

As expected, NonStore drove the growth and their performance was “off the chart”. Performance must exceed 100% for a group to “earn its share”. Only NonStore and Health/Drug exceeded 100%. All others underperformed. This is interesting but not really usable. We must “drill down” to the channel level to find out what is really happening in Retail. We will do that by analyzing key channels within the Subgroups, starting with Furniture, Appliance & Electronics stores.
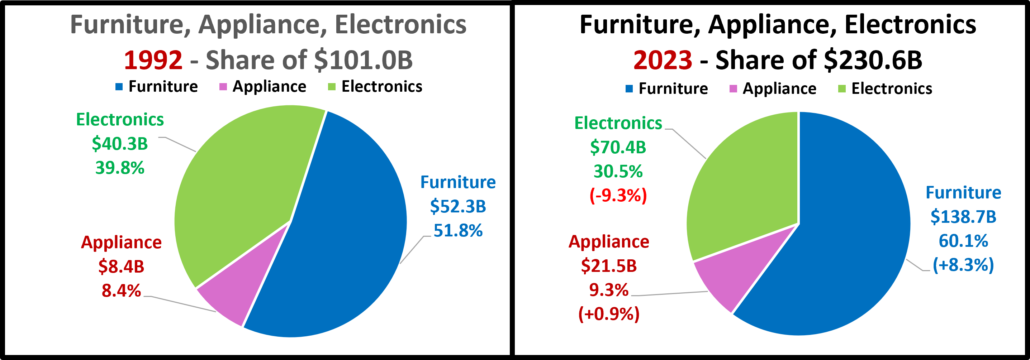
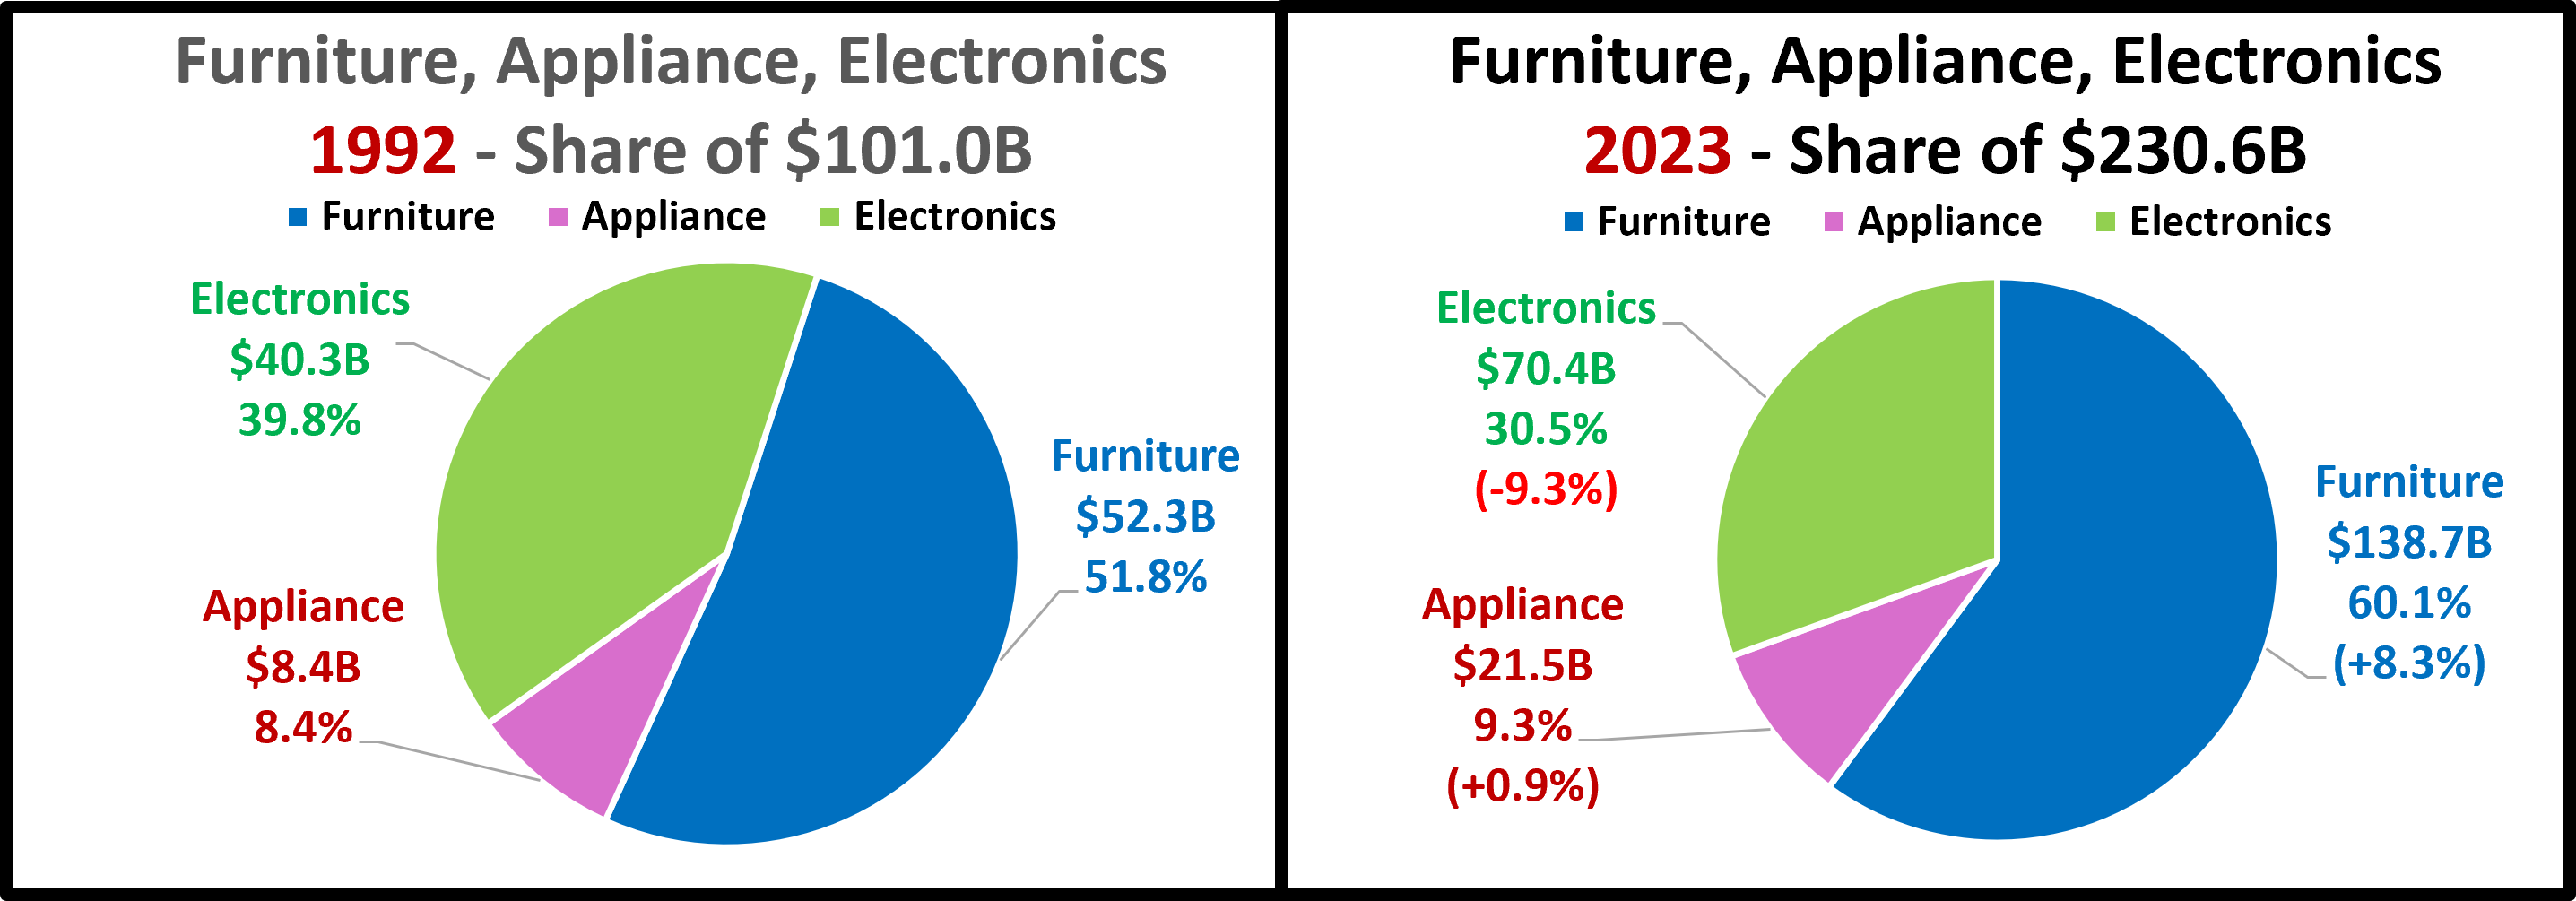
The Subgroup loss 3.6% share of Relevant Retail. Within the subgroup, Electronics lost almost 25% of its share of group $. Most was picked up by Furniture but a little by Appliances. Let’s look at their cumulative growth by year in a line graph.
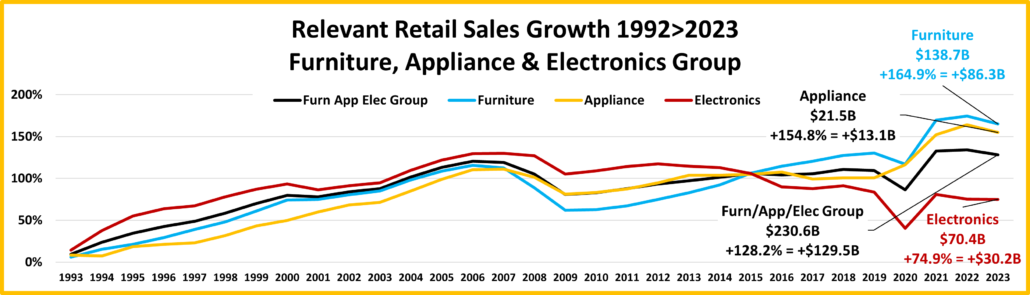
All had big drops in 2009 but Appliance sales increased in 2020. They have similar patterns but with some differences.
Relevant Retail: +301.7% Furniture, Appliance, Electronics Subgroup: 128.2%
Electronics – $70.4B; +$30.2B (+74.9%); avg: +1.8%; They had strong consistent growth through 2007. Since then, they have been on a rollercoaster but trending down from their 2007 peak. Biggest Chges – ↑: 2021: +28.8%; ↓: 2020: -23.5%
Appliance – $21.5B; +$13.1B (+154.8%); avg: +3.1%; They had a big 2008 & 2009 recession drop but sales actually grew in 2020 and after, until dropping in 2023. Biggest Changes – ↑: 2021: +16.5%; ↓: 2009: -10.0%
Furniture – $138.7B; +86.3B (+164.9%); avg: +3.2%; $ dropped 2007>2009, 2020 & 2023. The biggest decrease was -14.2% in 2009. In 2007 their growth fell below the subgroup. They have exceeded it 2016>23. Biggest lift – 2021: +24.3%
Building Material/Farm

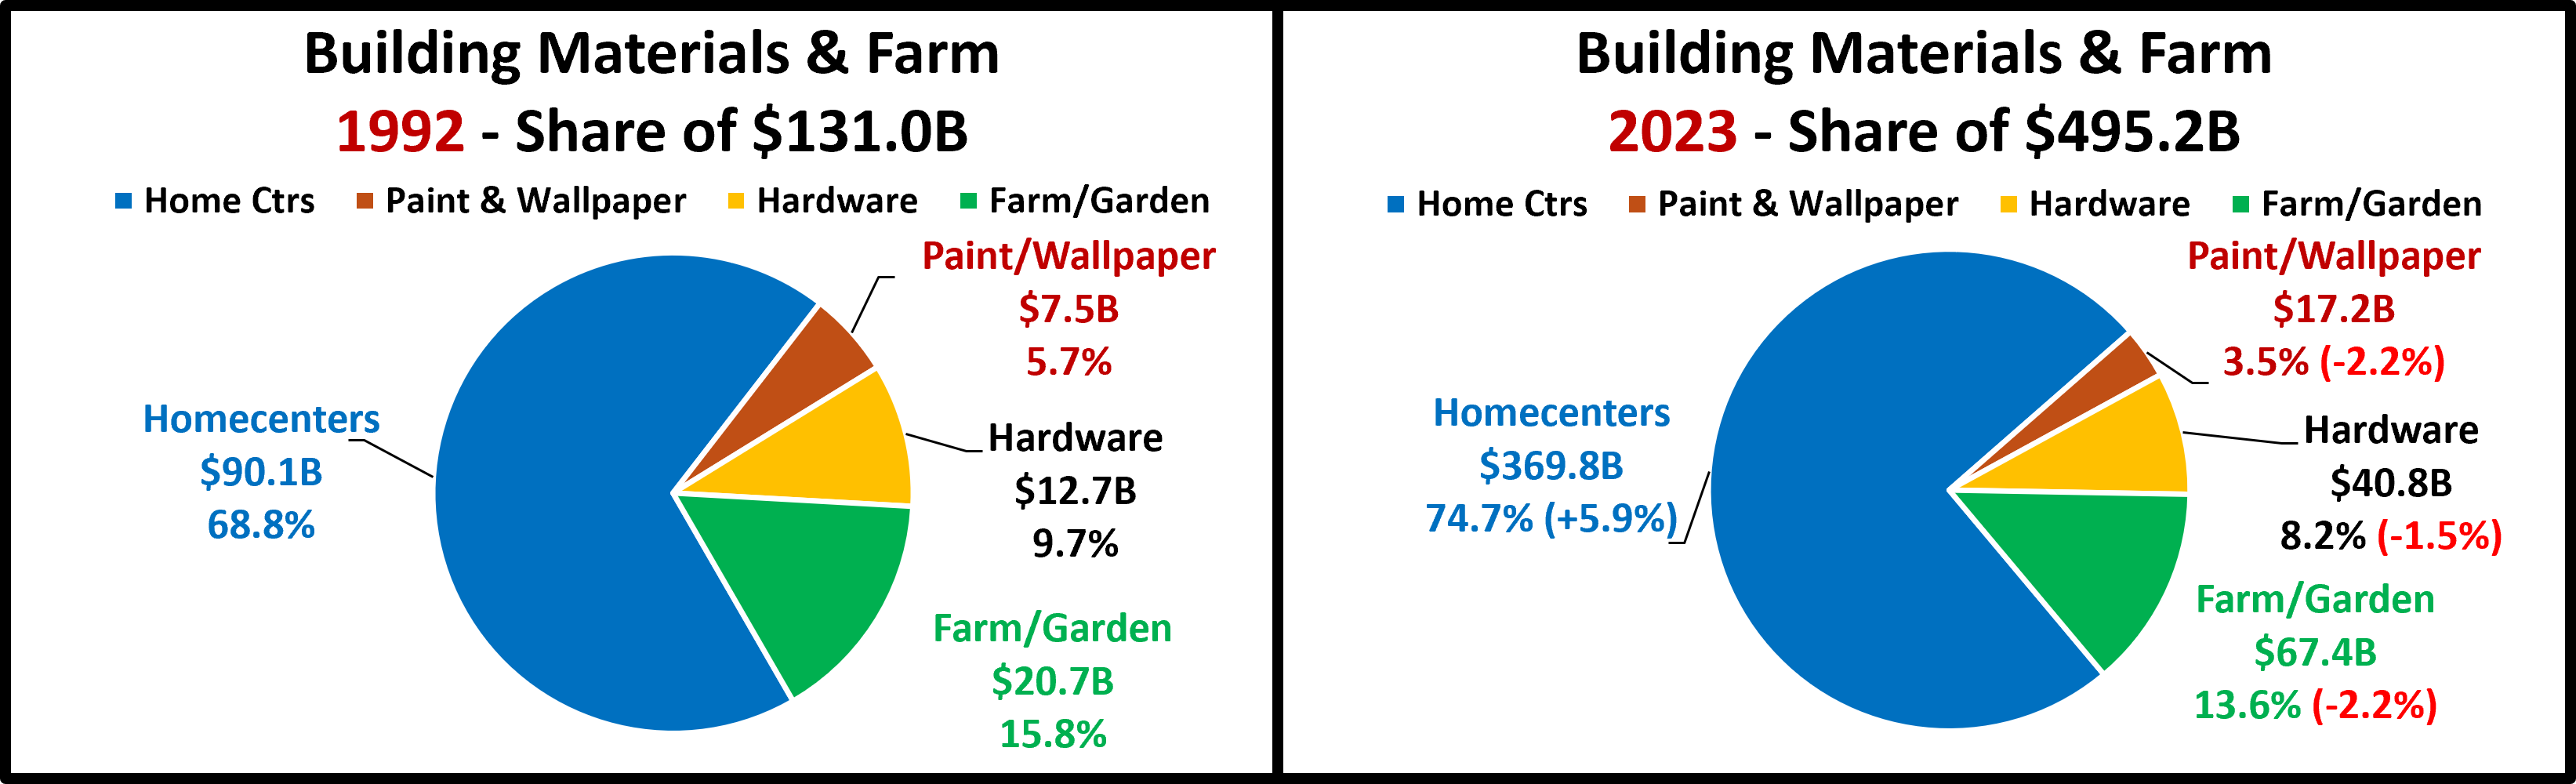
The Subgroup lost only -0.6% share of Relevant Retail $. Within the Subgroup, Homecenters “rule” and only they gained share, +5.9%. The drops were pretty balanced, ranging from -1.5% for Hardware to -2.2% for Farm and Paint/Wallpaper.

Homecenters obviously drive the Subgroup’s business. Sales for all channels fell during the recession but grew in the pandemic as consumers focused on “home”.
Relevant Retail: +301.7% Building Materials/Farm Subgroup: 278.0%
Paint/Wallpaper – $17.2B; +$9.7B (+129.3%); avg: +2.7%; They had a long 2007>2009 drop. The biggest decrease was in 2009, -15.5%. They didn’t recover until 2015. Their biggest lift was +10.8% in 2005 but 2022 was a close 2nd, +10.3%.
Hardware – $40.8B; +$28.1B (+221.9%); avg: +3.8%; Their recession decrease was 2008>2009 with the biggest drop in 2009, -7.0%. They recovered in 2012. They’ve only had 3 drops since 92 but they’ve only had 1 10+% lift, +20.4% in 2020.
Farm – $67.4B; +$46.7B (+226.0%); avg: +3.9%; They have had 4 occasional 1 year decreases. The biggest was -11.8% in 2009. Their largest lift was +18.6% in 2021, which surpassed +16.7% in 2020.
Homecenters – $369.8B; +279.6B (+310.2%); avg: +4.7%; Their growth slightly exceeded Relevant Retail, so they gained share. They have always led the group in cumulative growth. They’ve only had 5 drops – 2007>10 & 2023. The biggest decrease was -13.3% in 2009. Their 2 biggest increases were +14.3% in 2021, which beat +13.0% in 2020.
Food & Beverage
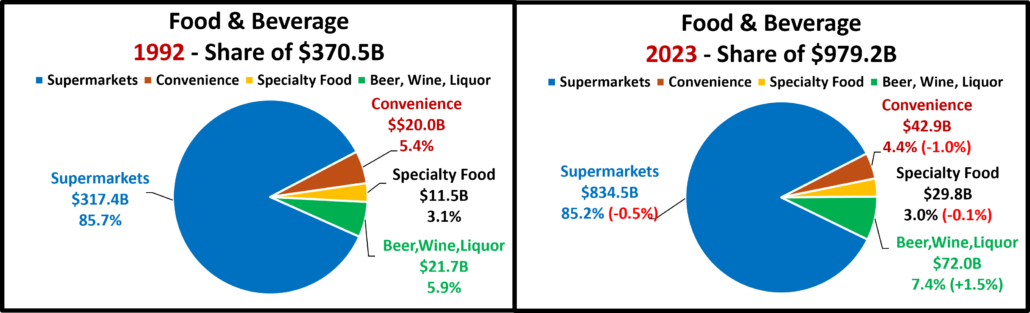
Food & Bvg was the biggest loser in share of Relevant Retail, -10.3%. Within the Subgroup there was little change. Supermarkets still have 85% of the $. However, Alcohol Stores were the only channel that gained share, +1.5%.
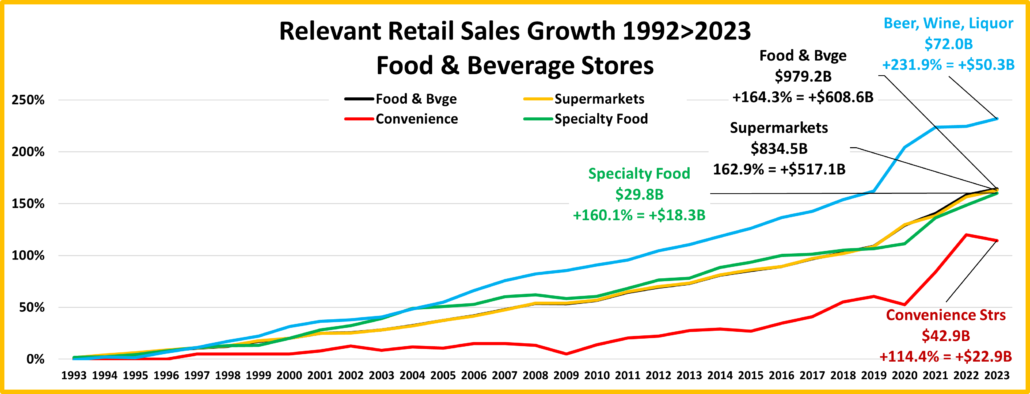
The Subgroup has shown consistent growth with only 1 down year, -0.2% in 2009. Alcohol Stores have been the growth leader since 2006. Only Convenience Stores have had a lot of fluctuations. The others have very consistent patterns.
Relevant Retail: +301.7% Food & Beverage Subgroup: 164.3%
Convenience Stores – $42.9B; +$22.9B (114.4%); avg: +2.5%; There have been a lot of ups & downs since 2001 with 8 drops. One lasted from 2007>09. The biggest were 2009: -7.4%; 2020: -5.0%. The biggest lifts: 2021: 20.6%; 2022: 19.6%.
Specialty Food – $29.8B; +$18.3B (+160.1%); avg: +3.1%; They have had slow, but consistent growth with only 1 down year, -2.2% in 2009. Their big COVID lift, +11.7% didn’t happen until 2021 but strong growth continued through 2023.
Supermarkets – $834.5B; +$517.1B (+162.9%); avg: +3.2%; Although they have lost a big share of Relevant Retail $, their growth has been very consistent. They have had no decreases since 1992. Their smallest increase was +0.1% in 2009. As expected, their biggest lift occurred in 2020, +10.1%. It was their only double-digit increase.
Beer, Wine & Liquor – $72.0B; +$50.3B (+231.9%); avg: +3.9%; Their growth is 42% more than Supermarkets. It has also been consistent with drops in only 1993 (-0.7%) & 1995 (-0.5%). Their biggest & only double-digit lift was +16.1% in 2020.
Health & Drug Subgroup
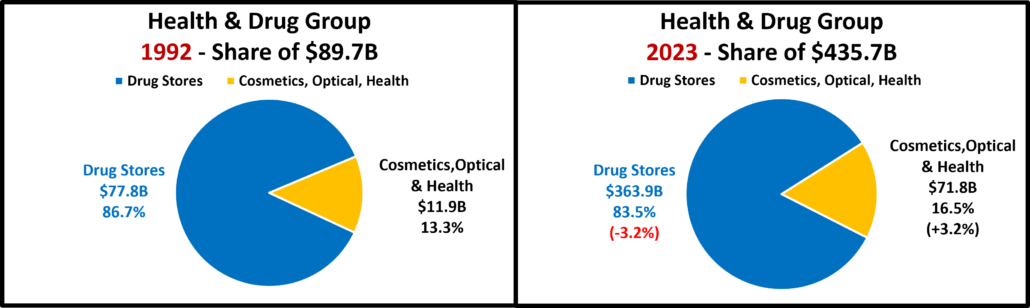
Health/Drug gained 1.5% in share of Relevant Retail. NonStore had the biggest gain and was the only other Subgroup to gain share. Drug had a big sales increase but their share of $ within the Subgroup actually decreased by -3.2%.
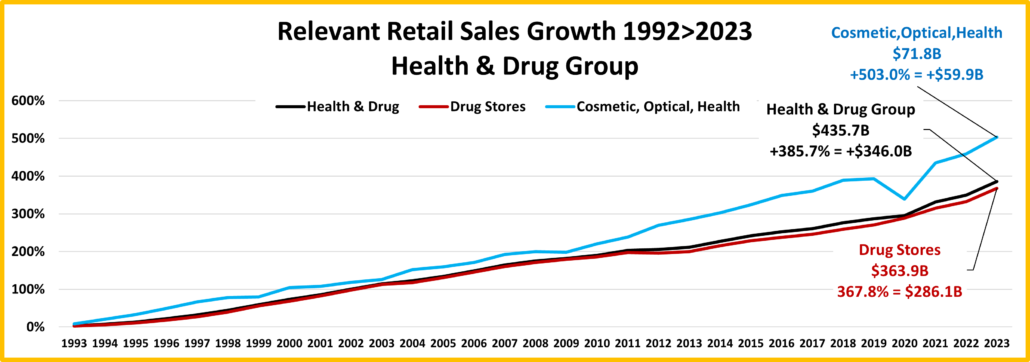
The Subgroup has shown consistent, above average growth, +5.2%. They have had no down years, but only 1 year with a double digit increase, +10.1% in 1999. Non-Drug Store $ took a big dive in 2020, but it had little impact on the Subgroup.
Relevant Retail: +301.7% Health & Drug Subgroup: +385.3%
Cosmetic, Optical, Health – $71.8B; +$59.9B (503.0%); avg: +6.0%; Except for a small drop in 2009 and a big one in 2020, -11.0% they have had steady growth. It has accelerated since 2010. The biggest lift, +22.0%, was in their 2021 recovery.
Drug – $363B; +$286.1B (+367.8%); avg: +5.1%; They have had only 1 down year, -0.6% in 2012. Their biggest lift and only double-digit increase, +11.9% occurred back in 1999. Obviously, Drug “rules” this Subgroup but the lift is somewhat deceptive. Actual Drug Stores, both chain and independent have been struggling recently as a huge number of Grocery & General Mdse stores have added a pharmacy within the store and online pharmacies have become a major force. The online only companies are still classified as Drug Stores, even though they have no physical outlets.
Clothing & Accessories
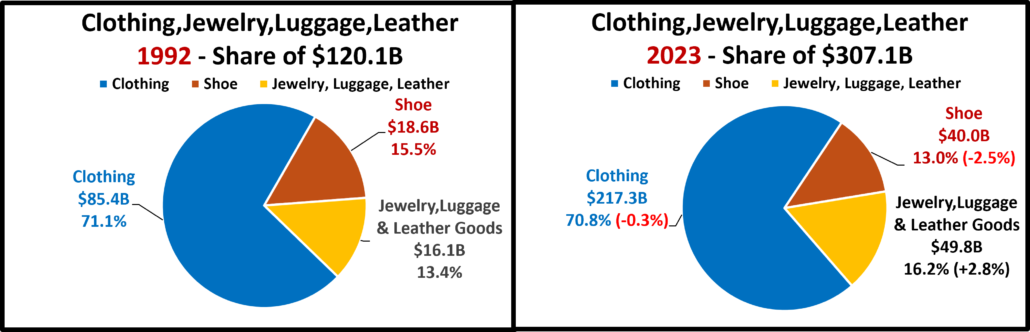
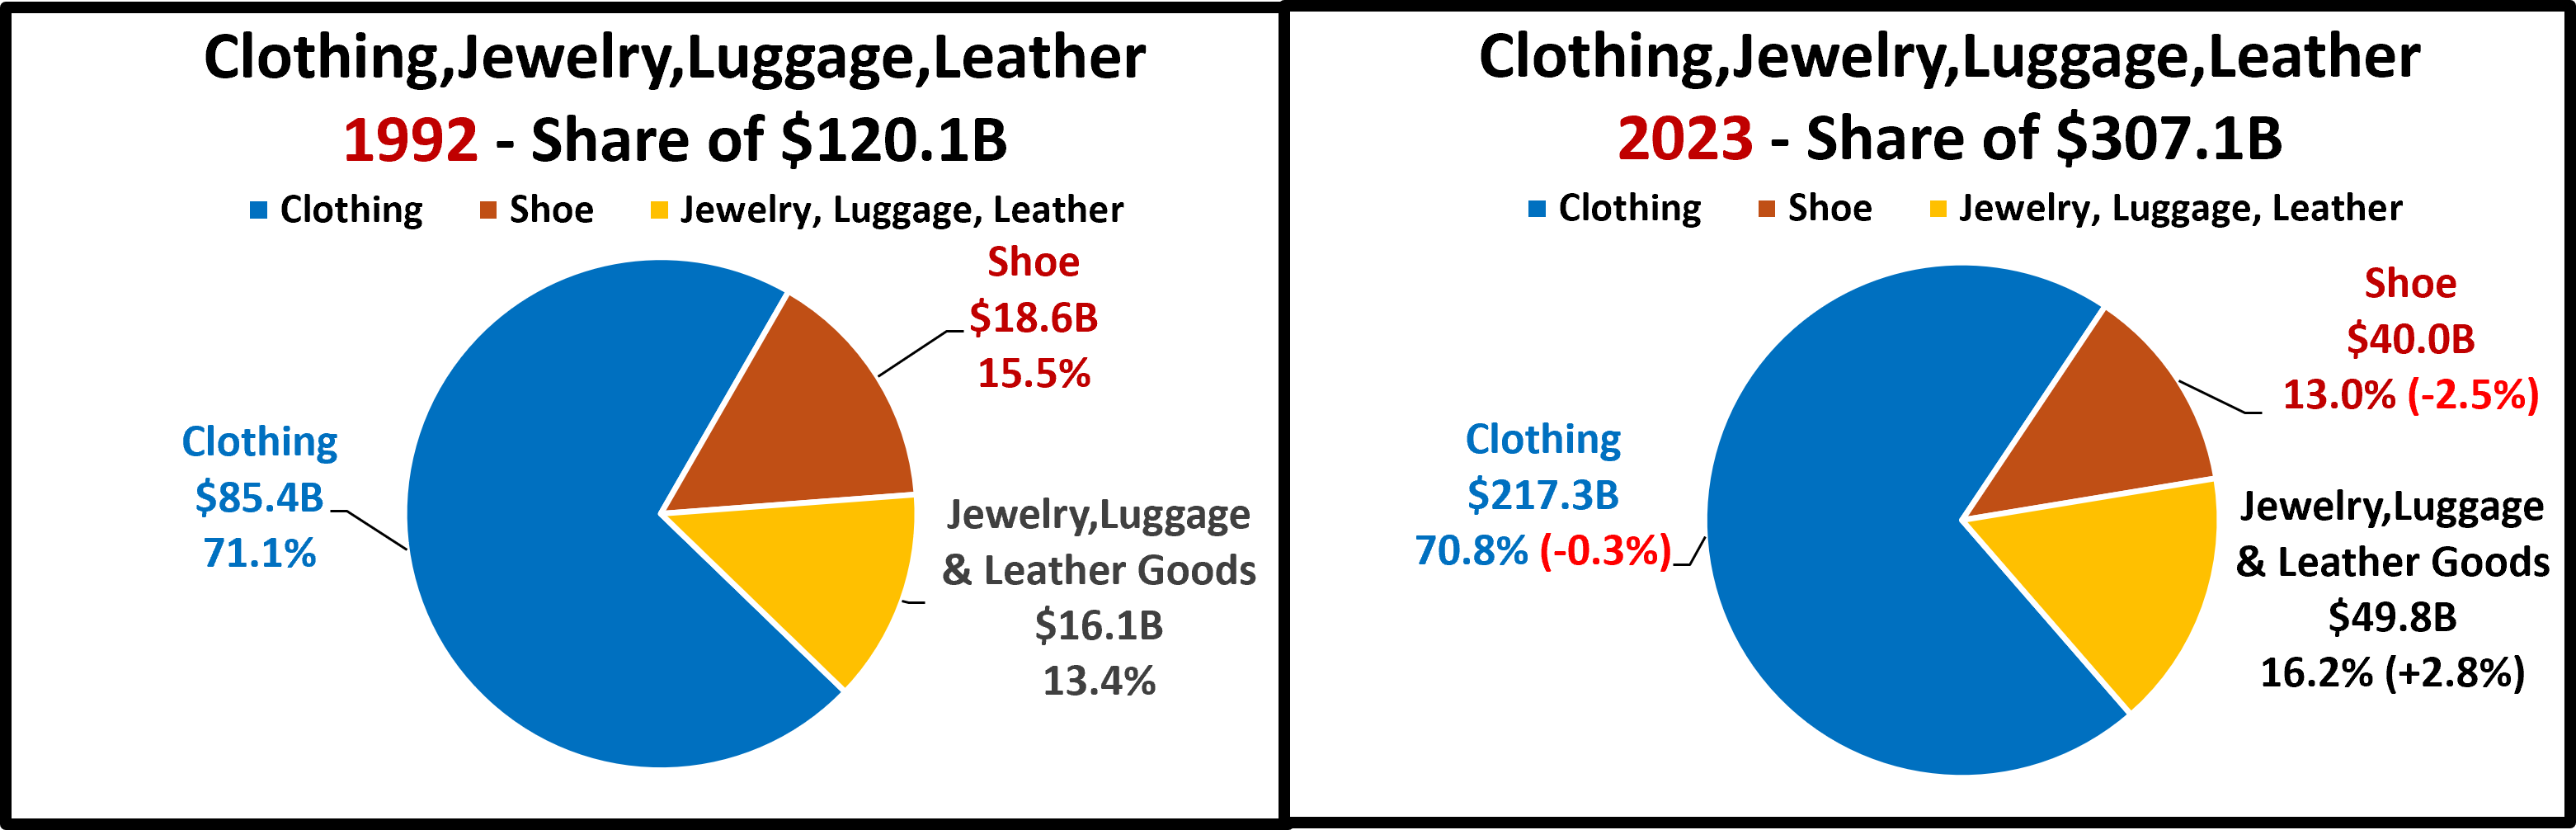
The Clothing & Acc. Subgroup’s share of Relevant Retail $ fell from 9.7% to 6.2%, a 36% drop. Within the Subgroup, only Jewelry, Luggage, Leather gained share. Shoes’ share fell -2.5% but the big Clothing channel only lost -0.3%.
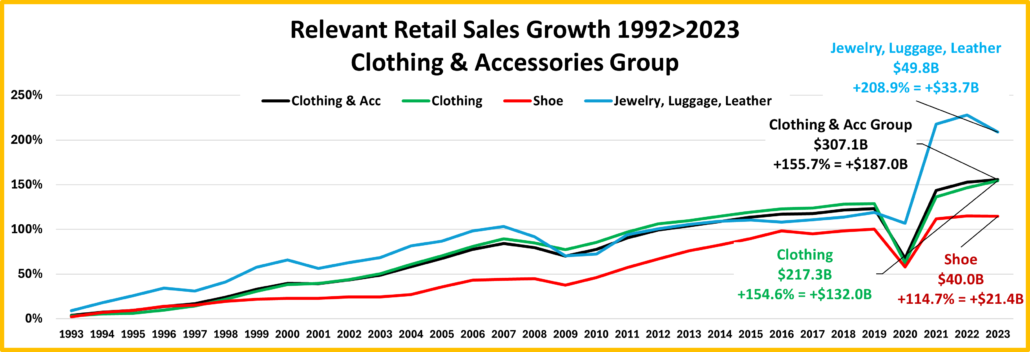
All channels have a similar pattern, with Recession & COVID drops. Clothing is definitely the driving force. This is very apparent as the sales pattern of the Subgroup almost exactly matches the pattern of Clothing.
Relevant Retail: +301.7% Clothing & Accessories Subgroup: +155.7%
Shoe Stores – $40.0B; +$21.4B (+114.7%); avg: +2.5%; They had 5 annual dips in $, including 2023. Sales dropped -4.9% in 2009 but -21.2% in 2020. They had a strong recovery, +34.1% in 2021. These were their only double-digit changes.
Clothing – $217.3B; +132.0B (+154.6%); avg: +3.1%; They only had 3 annual decreases, 2008, 2009 and the biggest, -29% in 2020. They had a huge recovery lift of +45.4% in 2021. Like Shoes, these were their only double-digit changes.
Jewelry, Luggage, Leather – $49.8B; +$33.7B (+208.9%); avg: +3.7%; They had the largest increase but also the most fluctuation – 7 decreases. The worst drop was -11.2% in 2009. They had a huge 53.6% lift in 2021 after -5.4% in 2020.
Sporting Goods, Hobby, Toy, Book, Music

This smallest, “entertainment” Subgroup lost -1.4% in share of Relevant Retl $, -40%. Within the Subgroup, Sporting Gds’ share jumped from 36.3% to 61.4%. The other 3 channels all had significant losses, with Books leading the pack, -11.3%.
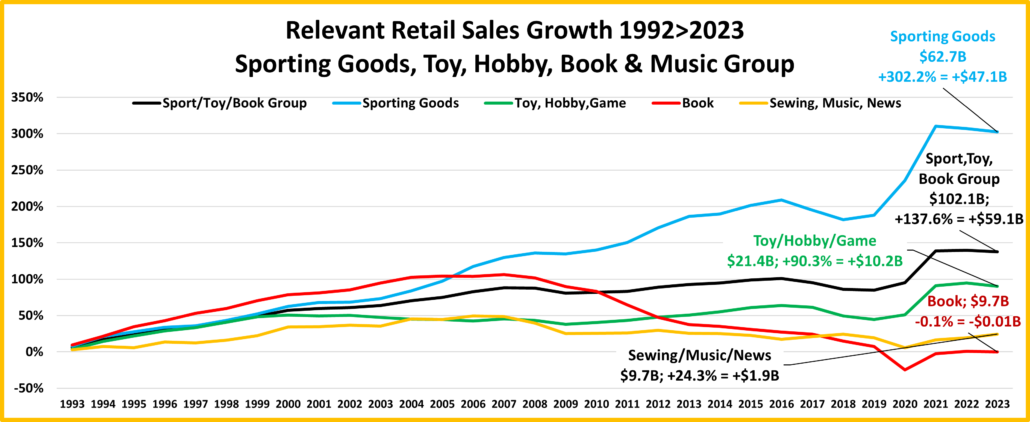
Sporting Goods moved to the top in 2006 and stayed there. Toy/Hobby/Game essentially stabilized while Book and Sewing/Music/News began to decline. All had their biggest lift in 2021 then growth flattened or declined.
Relevant Retail: +301.7% Sporting Goods, Toy, Hobby, Book, Music Subgroup: +137.6%
Book Stores – $9.7B; -$0.01B (-0.1%); avg: -0.002%; With the rise of the internet, sales have trended down since 2008. Their biggest drop, -30.0% was in 2020, followed by a +29.7% lift in 2021. They are 1 of only 2 negative channels.
Sewing, Music, News – $9.7B; +$1.9B (+24.3%); avg: +0.7%; This group also includes CD stores. Sales turned down in 2008, then stabilized until a -11.4% drop in 2020 which was followed by their biggest lift, +9.9% in 2021.
Toy, Hobby, Game – $21.4B; +$10.2B (+90.3%); avg: +2.1%; Sales were stable around $16B from 1998 to 2013, when they turned slightly up. $ fell 2017>19, grew 2020>22 then dropped in 23. Biggest changes: 2018, -7.3%; 2021, +26.4%.
Sporting Goods – $62.7B; +$47.1B (+302.2%); avg: +4.6%; Unlike the others, this channel is driven by physical activity. Its growth is strong, even exceeding Relevant Retail. Sales dropped in 2009, 2017>18 & 2022>23. The biggest drop was -4.5% in both 2017 & 2018. Their sales actually grew +16.6% in 2020, but they beat that with a +22.3% lift in 2021.
General Merchandise
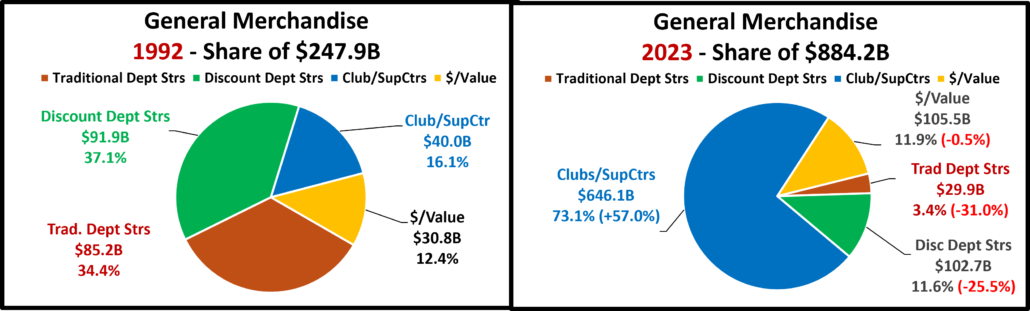
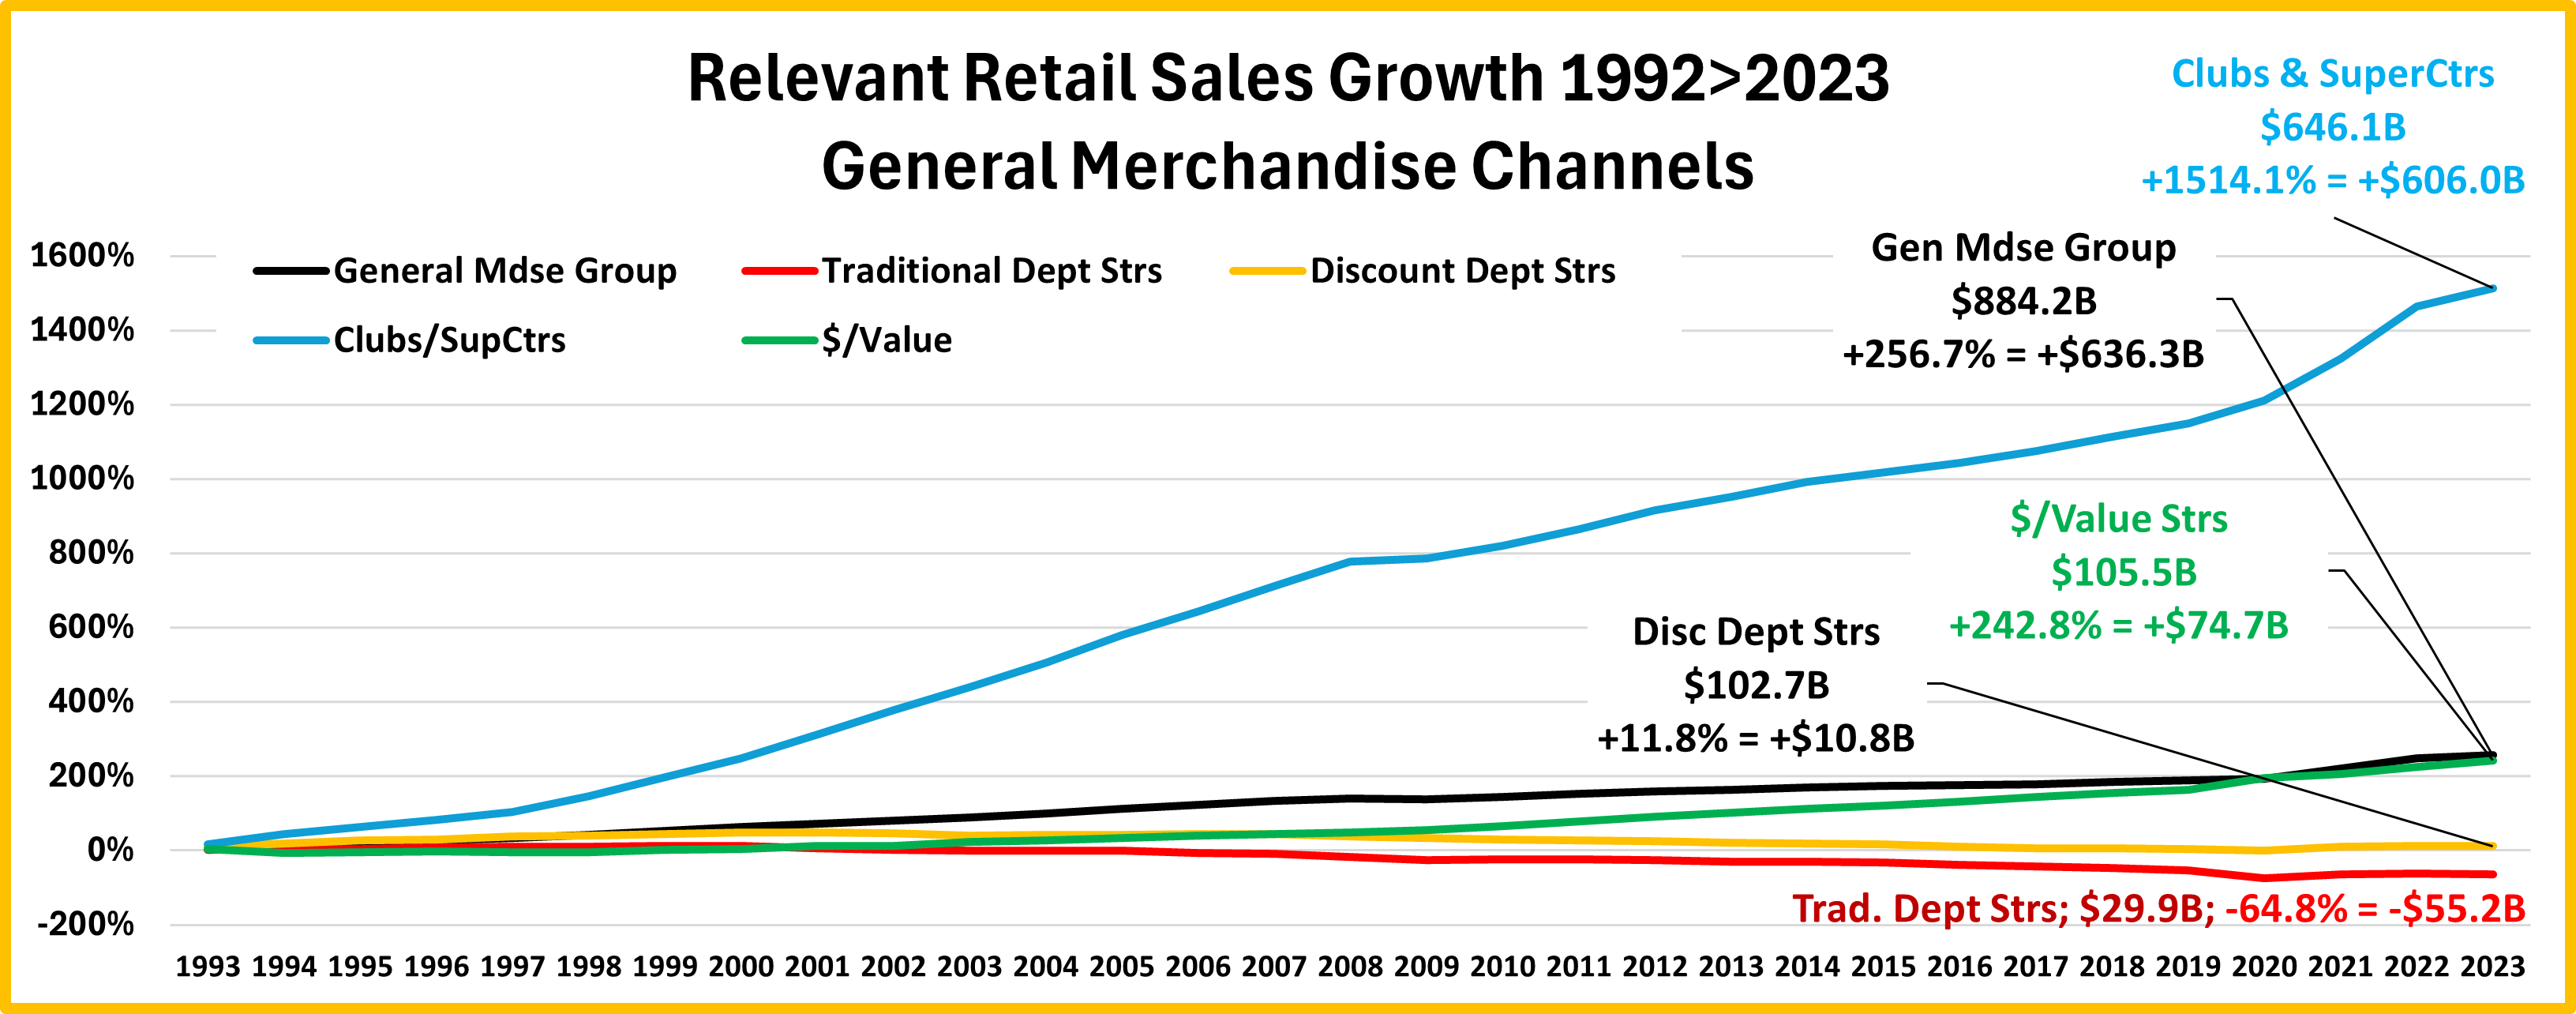
This Subgroup lost 2.2% in its share of Relevant Retail $. Within the Subgroup, there were huge changes. While $/Value stores essentially held their place, -0.5%, Clubs/SuperCenters’ share skyrocketed from 16.1% to 73.1%. Department Stores – Traditional & Discount paid the price. Their combined share fell from 71.5% in 1992 to 15.0% in 2023.

You see 3 different patterns. 1. Strong Growth: Club/SupCtr; 2. Stability: $/Value; 3. Decline: Dept Stores
Relevant Retail: +301.7% General Merchandise Subgroup: +256.7%
Traditional Department Stores – $29.9B; -$55.2B (-64.8%); avg: -3.3%; They have been fading for years with only 11 “up” years since 1992. Their biggest drop was -46.2% in 2020 but they “recovered” with a +46.6% lift in 2021.
Discount Department Stores – $102.7B; +10.8B (11.8%); avg; +0.4%; They are also fading, with only 4 “up” years since 2001. In fact, they are going away. Many are adding a big grocery section. They will be SupCtrs. The others, just Dept Strs.
$/Value Stores – $105.5B; +$74.7B (242.8%); avg: +4.1%; They evolved from 5&10¢ Stores. They have had steady, mid-level growth with no drops since 1998, but some stores are now struggling, especially with high cumulative inflation. Their biggest lift was +12.7% in 2020.
Warehouse Clubs/SuperCenters – $646.1B; +$606.0B (1514.1%); avg: +9.4%; They have become the dominant General Merchandise channel and their impact on the Relevant Retail Marketplace is second only to the Internet. They have had no down years. Their smallest lift was +0.9% in 2009. They had all double digit increases until 2006. Their biggest increase this century was +18.0% back in 2001.
Miscellaneous Stores
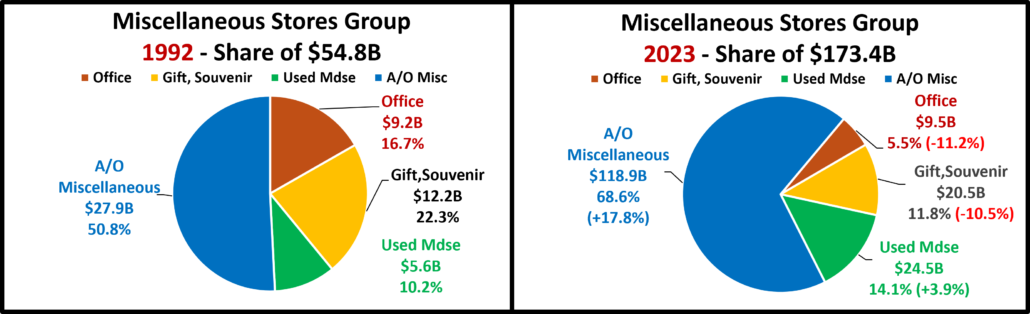
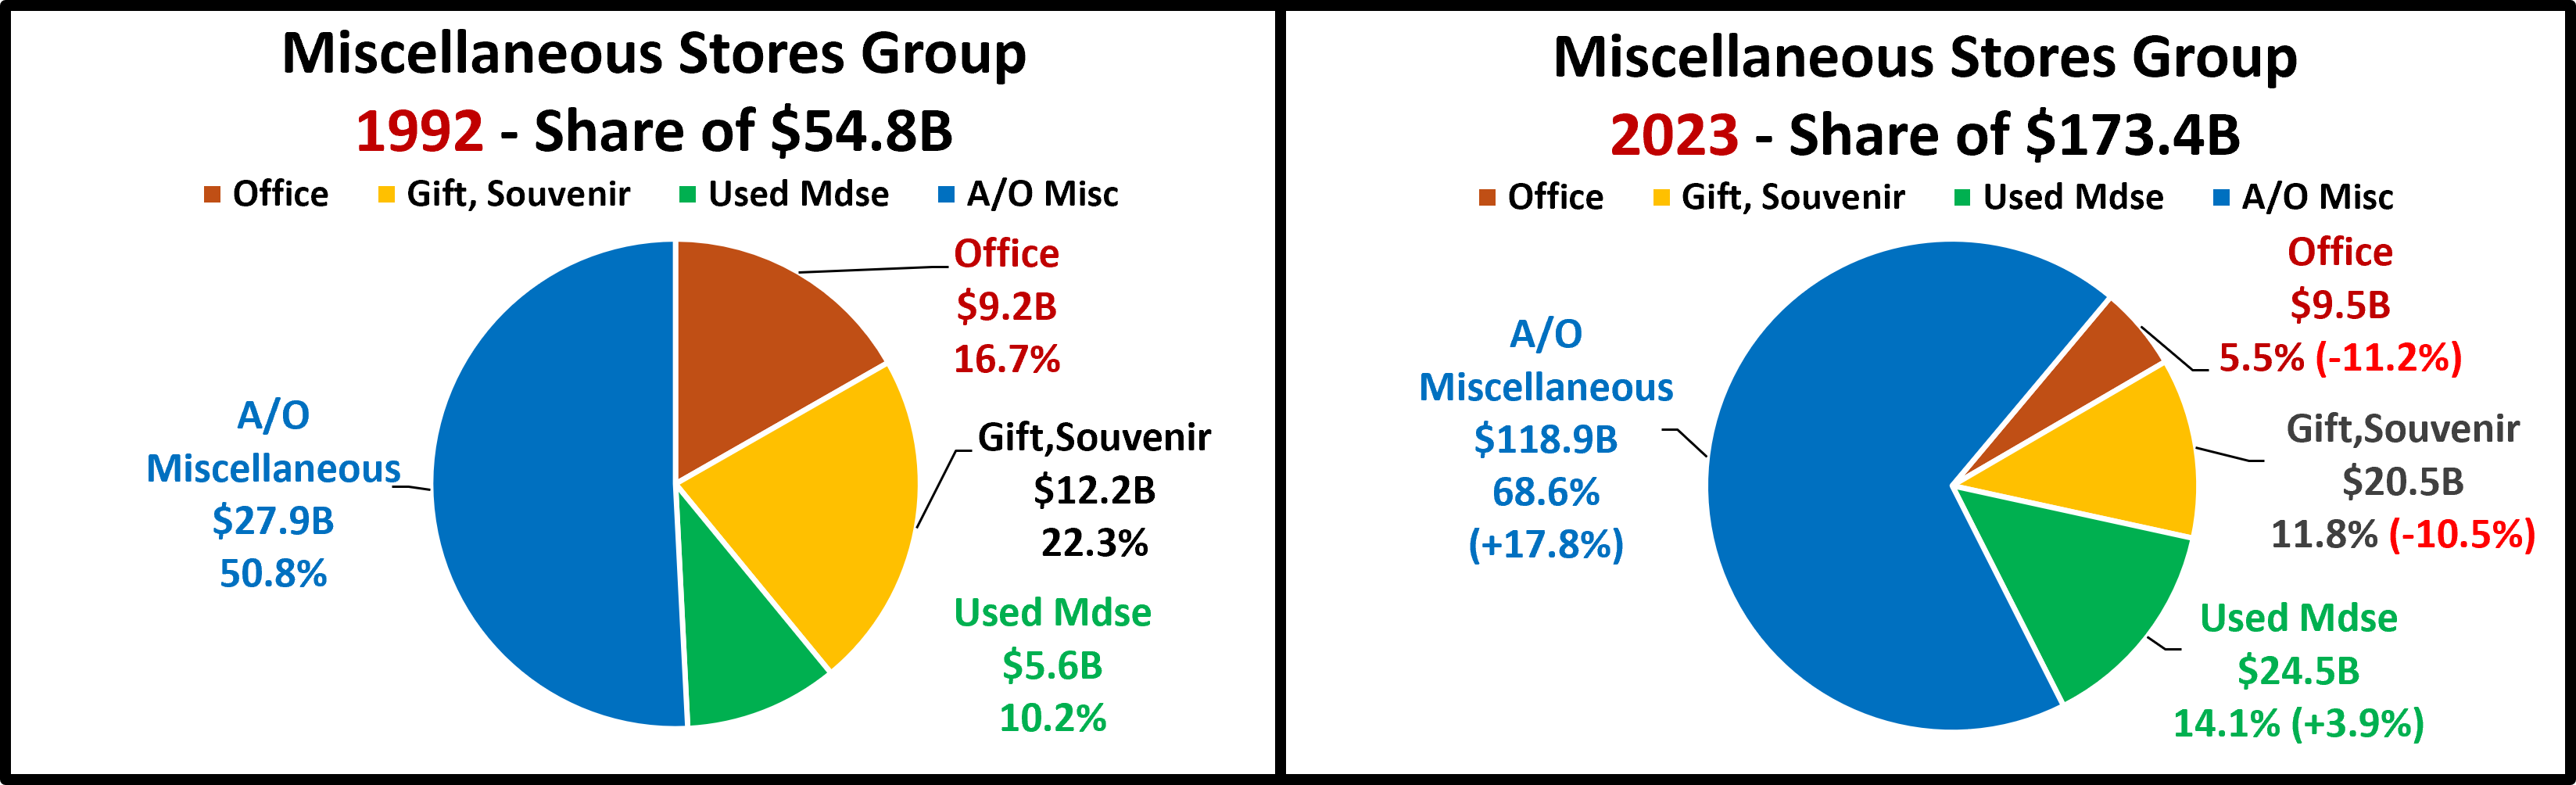
This small, mixed Subgroup lost only 0.9% share of Relevant Retail $. Within the group, A/O Miscellaneous (includes Pet) became dominant. Used Mdse also gained ground. The other 2 channels had double digit losses in share.
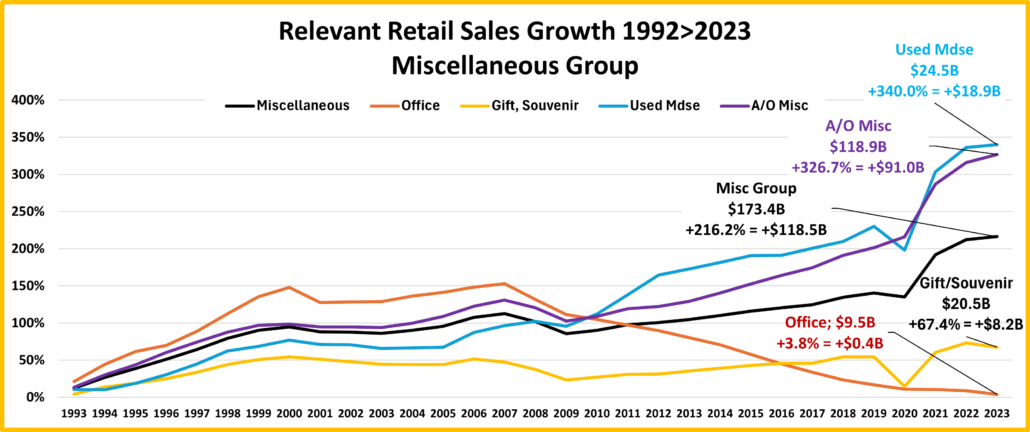
A mixture of channels & patterns – Growth, Stability, Decline. All had recession drops & sales for all, but A/O fell in 2020.
Relevant Retail: +301.7% Miscellaneous Store Subgroup: +216.2%
Office – $9.5B; +0.4B (+3.8%); avg: +0.1%; They have been headed down since 2007, with a sales decrease every year. The biggest drop was -8.8% in 2009. Their biggest lift, +21.2% happened over 30 years ago in 1993.
Gift & Souvenir – $20.5B; +$8.2B (+67.4%); avg: +1.7%; For years their sales were steady around $17>18B. They had big drops in 2009 & 2020. They recovered strongly from COVID, +29.9% in 2021 and hit a new $ high, $21.2B in 2022.
A/O Miscellaneous – $118.9B; +$91.0B (+326.7%); avg: +4.8%; This mixed group has had strong, steady growth since an -8.1% drop in 2009, including a +22.5% lift in 2021. Their growth exceeds Relevant Retail’s increase.
Used Merchandise – $24.5B; +$18.9B (+340.0%); avg: +4.9%; As consumers’ have become more focused on value, the appeal of this channel has increased. They had drops in 2009 & 2020 (-9.7%) but a huge, +35.4% lift in 2021.
NonStore

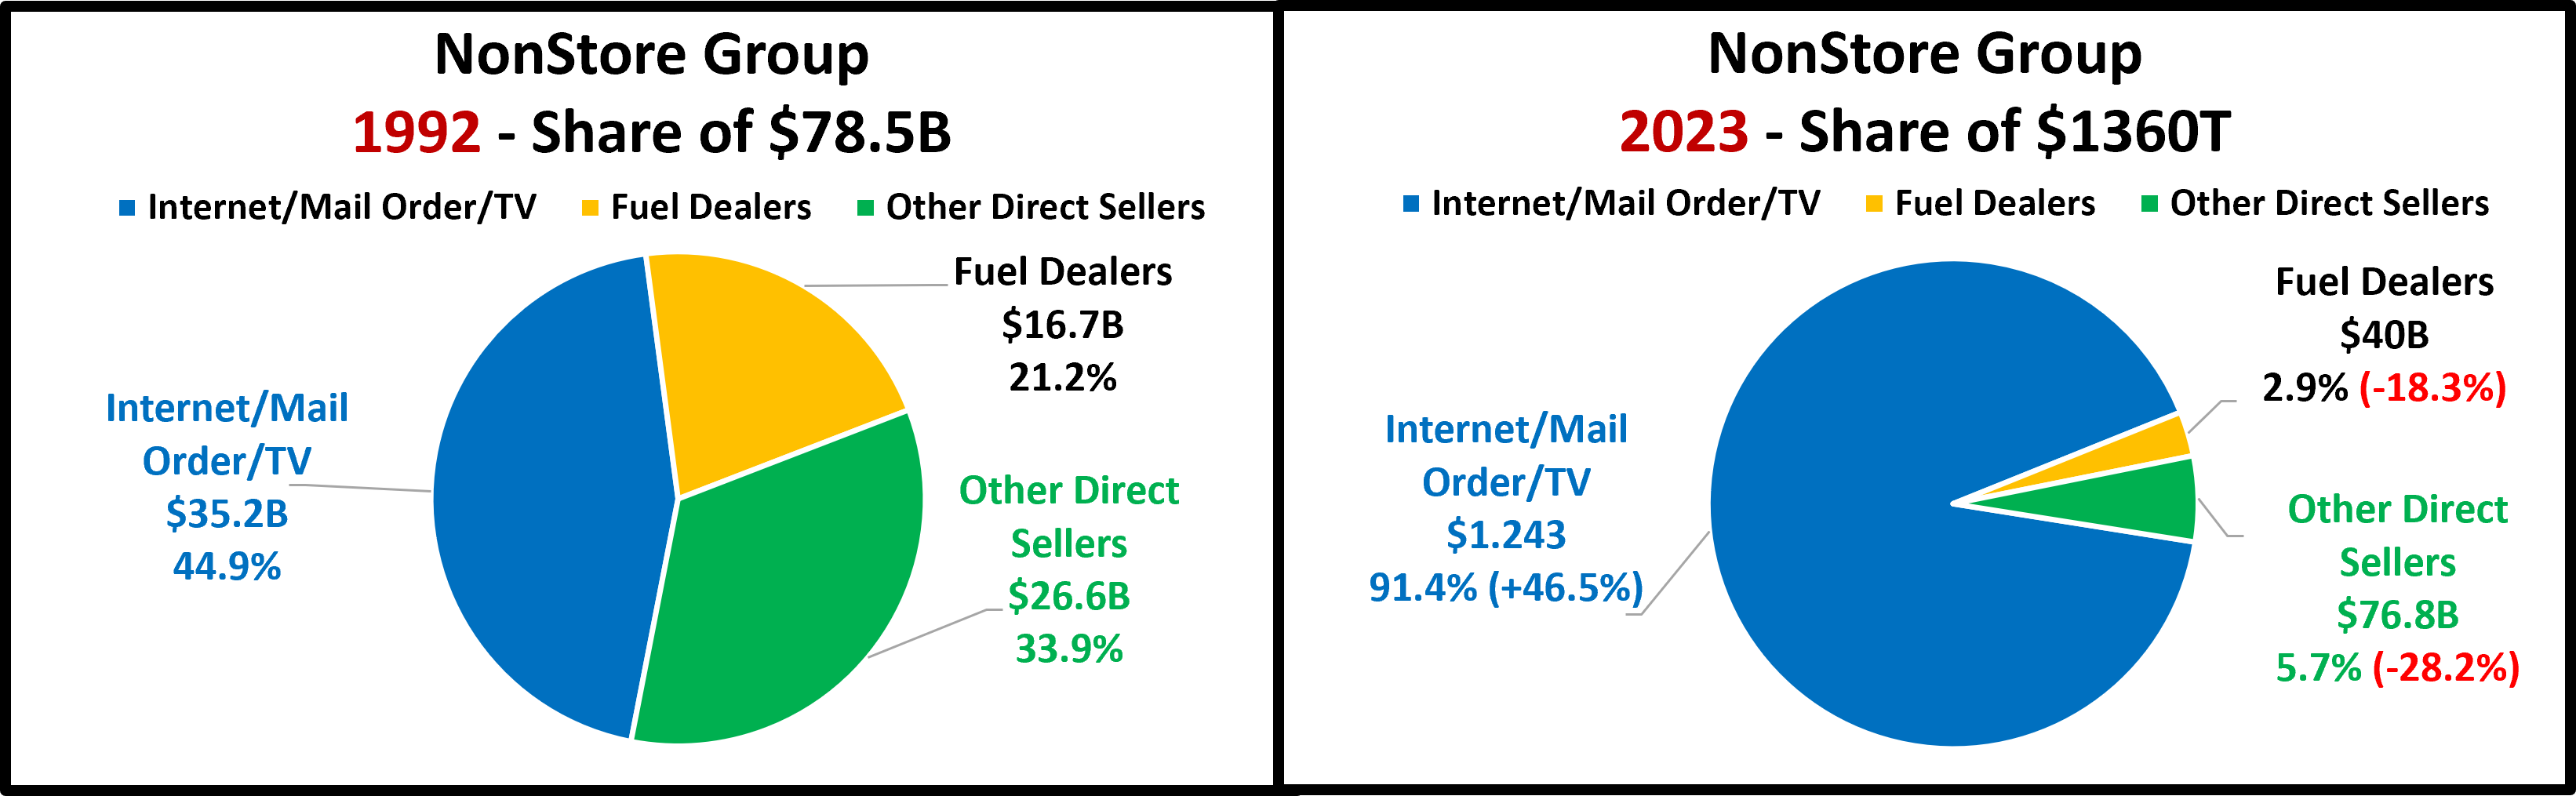
Thanks to the Internet, NonStore gained 21.1% in share and now have the biggest portion of Relevant Retail $, 27.4%. With 91.4% of the $, the Internet essentially owns the NonStore Subgroup.
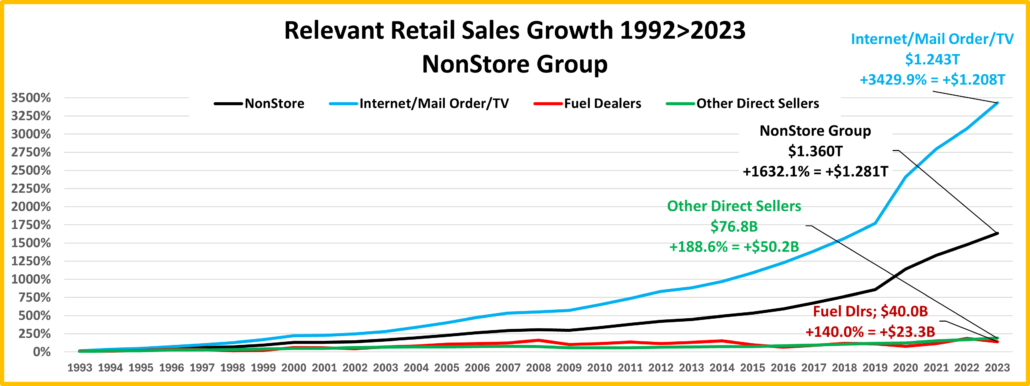
Fuel & Other Direct more than doubled sales but that is nothing compared to the Internet, which sold 35 times more $.
Relevant Retail: +301.7% NonStore Subgroup: +1632.1%
Fuel Dealers – $40.0B; +$23.3B (+140.0%); avg: +2.9%; This small channel had 16 double digit sales changes. The worst was -23.2% in 2009. The best was +34.0% in 2000. We should note that they were -15.6% in 23 after being +33.1% in 22.
Other Direct Sellers – $76.8B (+188.6%); avg: +3.5%; Their only down years were 2001 & 2008>10. The biggest drop was -9.2% in 2009. Their biggest lift was +12.3% in 2021. They had only 1 other double digit change, +10.8% back in 1994.
Internet/Mail/TV – $1.243T; +$1.208T (+3429.9%); avg: +12.2%; Since 1992 they have had no down years and 23 years with double digit growth. Best yr: +34.1% in 2020. With Selection, Value & Convenience, they are now America’s choice.
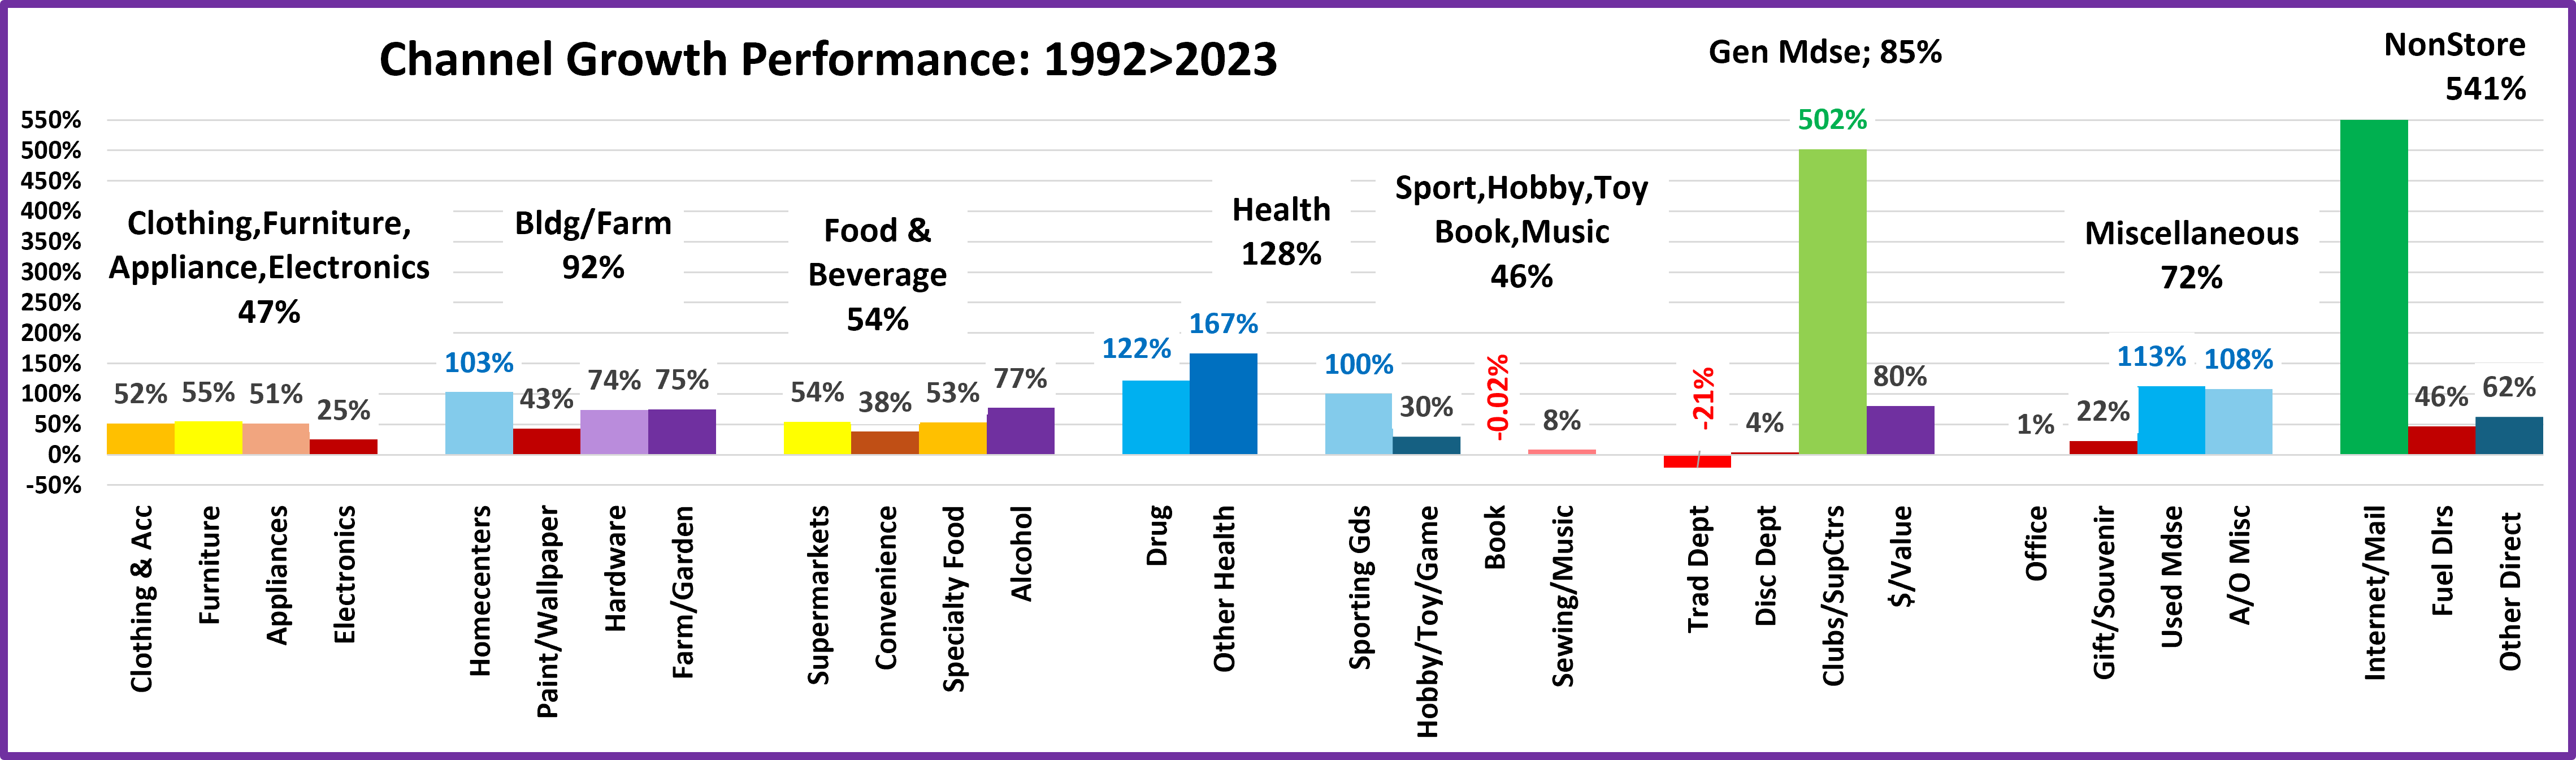
Now, it’s time to wrap our analysis up and lay out the results. The best way to compare channels is by Performance – divide a channel’s share of Relevant Retail’s growth by their 1992 share of $ales. Channels with a score of 100+% are earning their share. Here are the results for 29 channels.
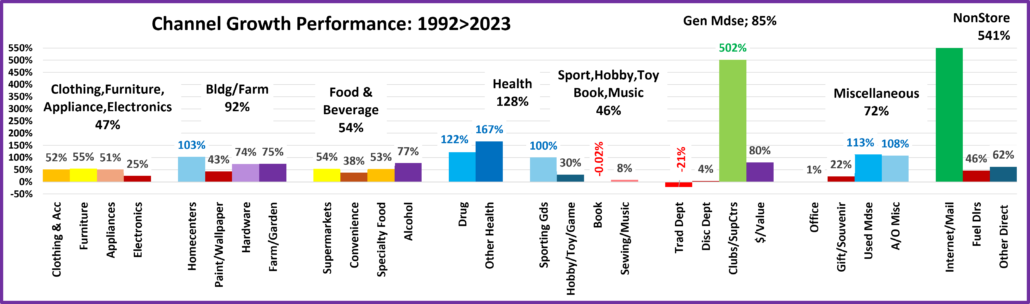
There were only 2 Subgroups with 100+% Performance. There are 8 individual channels. Here are the 100+% Winners:
- Internet/Mail 1137%
- Clubs/SupCtrs 502%
- NonDrug Health 167%
- Drug Stores 122%
- Used Mdse 113%
- A/O Misc. 108%
- Homecenters 103%
- Sporting Goods 100%
If performance is 30% or less, the channel is likely in trouble. Here are the 8 Worst Performers:
- Hobby,Toy,Game 30%
- Electronics 25%
- Gift/Souvenir 22%
- Sewing/Music 8%
- Disc Dept Strs 4%
- Office 1%
- Book -0.01%
- Reg Dept Strs -21%
Many of the other 13 channels have problems but right now are getting by. In fact, if you take NonStore out of total $, the 4 with a score of 70>99% are “winning” their battle against other brick ‘n mortar retailers with 100+% performance.
Summary
Key Consumer Drivers – Value (Quality + Price), Convenience, Selection along with a big drop in the importance of Brand
Biggest Retail Market Changes:
- Consumers’ Movement to online shopping – mostly to NonStore but also in Brick ‘n Mortar Retailers
- Growth of Warehouse Clubs & SuperCenters, largely at the expense of Grocery & Department Stores
- The fall of Department Stores – Traditional & Discount
- The increasing demise of Big Box Specialty Retailers – especially Books, CD’s, DVD’s, Toy, Game, Electronics…