Retail Channel $ Update – March Monthly & April Advance

In April, Commodities inflation vs last year slowed to 0.3% from 0.6% in March. Although radically down from its peak, cumulative inflation still impacts consumer spending. The YOY sales increase for April is below the 92>23 average (-20%) for Relevant Retail and for all but 2 channels. Prices are now deflating in many channels but still high vs 21, which slows growth in the amount of product sold. There is still a long road to recovery, so we’ll continue to track the retail market with data from 2 reports provided by the Census Bureau and factor in a targeted CPI from US BLS data.

The Census Bureau Reports are the Monthly and the Advance Retail Sales Reports. Both are derived from sales data gathered from retailers across the U.S. and are published monthly at the same time. The Advance Report has a smaller sample size so it can be published quickly – about 2 weeks after month end. The Monthly Report includes data from all respondents, so it takes longer to compile the data – about 6 weeks. Although the sample size for the Advance report is smaller, the results over the years have proven it to be statistically accurate with the Monthly reports. The biggest difference is that the full sample in the Monthly report allows us to “drill” a little deeper into the retail channels.

We will begin with the March Monthly Report and then go to the April Advance Report. Our focus is comparing to last year but also 2021 & 2019. We’ll show both actual and the “real” change in sales as we factor inflation into the data.

Both reports include the following:

  • Total Retail, Restaurants, Auto, Gas Stations and Relevant Retail (removing Restaurants, Auto and Gas)
  • Individual Channel Data – This is more detailed in the Monthly reports, and we’ll focus on Pet Relevant Channels.

The data will be presented in detailed charts to facilitate visual comparison between groups/channels. The charts will show 11 separate measurements. To save space they will be displayed in a stacked bar format for the channel charts.

  • Current Month change – % & $ vs previous month
  • Current Month change – % & $ vs same month last year and vs 2021.
    • Current Month Real change vs last year and vs 2021 – % factoring in inflation
  • Current Ytd change – % & $ for this year vs last year, 2021 & 2019.
    • Current Ytd Real change % for this year vs last year and vs 2021 and 2019
  • Monthly & Ytd $ & CPIs for this year vs last year and vs 2021 which are targeted by channel will also be shown. (CPI Details are at the end of the report)

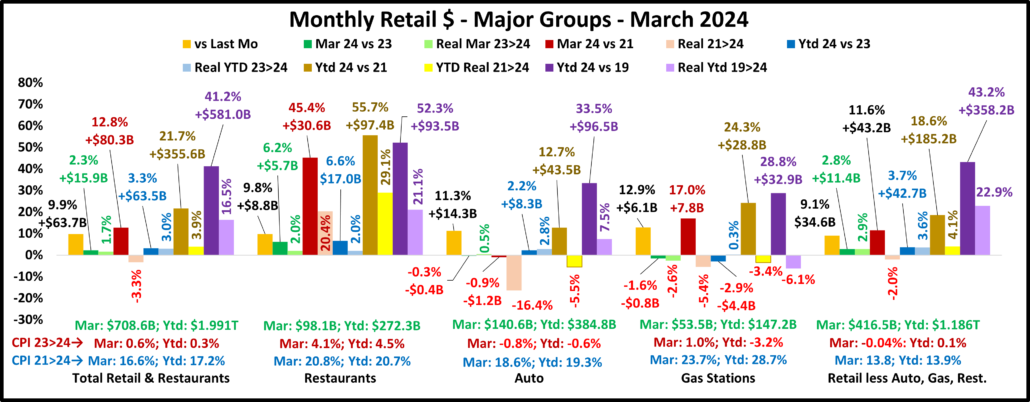
First the March Monthly. All were up from February. Gas Stations were down vs 23 & Auto vs Mar 23 & 21. All other actual $ are up. We should note that Gas Stations are still selling less product than in 2019 but the worst news is that Relevant Retail is really down vs Mar 21, after 4 straight months of all positives. ($ are Not Seasonally Adjusted)

The March Monthly is $4.1B less than the Advance report. Restaurants: No/Chg; Auto: +$0.2B; Gas Stations: -$0.2B; Relevant Retail: -$3.9B. As expected, $ales were up vs FebruaryE for all. Actual sales for all but Auto &  Gas Stations were positive in all measurements. Gas prices turned up and their sales were down vs 23. Auto prices are deflating but $ were down vs March 23 & 21. There were 8 “real” sales drops, up from only 2 last month. Gas Stations had 4 but only Restaurants had none. Restaurants have the biggest increases vs 21 & 19 but Relevant Retail is still the top “real” performer vs 2019. However, only 53% of their growth is real.

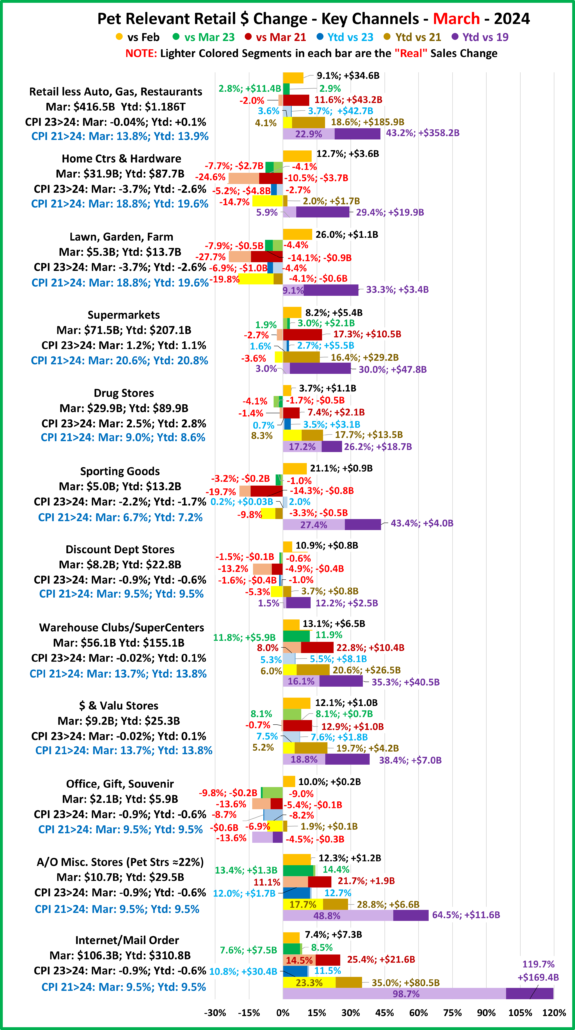
Now, let’s see how some Key Pet Relevant channels did in March in the Stacked Bar Graph Format

Overall– All 11 were up from February. vs Mar 23, Only 5 were actually and “really” up. Vs Mar 21, 6 were up but only 3 were real increases. Vs 2019, Off/Gift/Souv were actually & really down. All others were up in both measurements.

  • Building Material Stores – The pandemic focus on home has produced sales growth of 30.3% since 2019. Prices for the Bldg/Matl group have inflated 18.8% since 2021 which is having an impact. HomeCtr/Hdwe are only actually up Ytd vs 21 & 19 but Farm stores are only actually up vs 19. Despite strong deflation, all “real” measurements but Ytd vs 2019 are negative for both. Plus, only 22% of the overall Building Materials group’s 19>24 lift was real. Avg 19>24 Growth: HomeCtr/Hdwe: 5.3%, Real: 1.2%; Farm: 5.9%, Real: 1.8%
  • Food & Drug – Both are truly essential. Except for the pandemic food binge buying, they tend to have smaller changes in $. In terms of inflation, the Grocery rate is still less than half of the rate for Drug/Med products. Drug Stores are now actually down vs March 23 & really down vs 23 & 21 but 66% of their 2019>24 growth is real. Supermarkets had the biggest $ lift from February and all sales comparisons but “real” vs 21 are positive. However, only 10% of their 19>24 increase is real growth. Avg 19>24 Growth: Supermarkets: +5.4%, Real: +0.6%; Drug Stores: +4.8%, Real: +3.2%.
  • Sporting Goods Stores – They also benefited from the pandemic in that consumers turned to self-entertainment, especially sports & outdoor activities. Sales are up 21.1% from February but their only positives are actual & real Ytd vs 23 & 19. Prices are still deflating, -2.2% vs 23. Deflation started in April 23 and is a big change from +1.1% in 22>23 and +7.9% in 21>22. The result is that 63% of their 43.4% lift since 19 is real. Avg 19>24 Growth Rate is: +7.5%; Real: +5.0%.
  • Gen Mdse Stores – Sales were up double digits for all vs February. All actual sales were up for Club/SupCtr/$ Stores. $ stores were only really down vs Mar 21. On the other hand, Disc Dept Stores were only actually up Ytd vs 21 & 19 and only really up vs 19. Plus, only 12% of their growth is real. The other channels average 46% in real growth. Avg 19>24 Growth: SupCtr/Club: 6.2%, Real: 3.0%; $/Value Strs: +6.7%, Real: +3.5%; Disc. Dept. Strs: +2.3%, Real: +0.3%
  • Office, Gift & Souvenir Stores – Sales are up strong, +10.0% from February but it was not enough. They are negative in all actual comparisons but Ytd vs 21 and their real sales numbers are all negative. This includes all negatives vs 2019. Their recovery started late, and their slow progress has been stalled since June 23. Avg Growth Rate: -0.9%, Real: -2.9%
  • Internet/Mail Order – $ are up 7.4% from February and set a new monthly record of $106.3B. All measurements are positive, but their growth is only 50.3% of their average since 2019. However, 82.5% of their 119.7% growth since 2019 is real. Avg Growth: +17.1%, Real: +14.7%. As expected, they are still by far the growth leaders since 2019.
  • A/O Miscellaneous – Pet Stores are 22>24% of total $. In May 2020 they began their recovery which reached a record level of $100B for the first time in 2021. In 2022 their sales dipped in January, July, Sept>Nov, rose in December, fell in Jan>Feb 23, grew Mar>May, fell in Jun>Aug, rose in Sep>Nov, fell in Dec>Jan, then grew in Feb>Mar. All measurements vs 23, 21 & 19 are positive. They are still in 2nd place, behind the Internet, in the % increase vs 19 but fell to 2nd from 1st vs 21. Also, 76% of their 64.5% growth since 2019 is real. Average 19>24 Growth: +10.5%, Real: +8.3%.

March brought it’s usual lift. All channels – big and small were up vs February. However, the lifts were smaller as only 5 of 11 smaller channels were actually and really up vs March 23. Prices are now deflating in 9 of 11 channels but cumulative inflation is still a factor. Sales increases are lower as 8 of 11 channels were really down vs March 21. The Retail Recovery may be stalling. The commodities CPI slowed to 0.3% in April. Let’s look for any impact on Retail $ales.

April sales vs March only grew for Gas Stations, not surprising. A Mar>Apr Total Retail lift has only happened 5 times since 1992. However, the -1.0% drop is 48% less than the average of -1.9%. All actual $ measurements are positive vs 23, 21 & 19 for all groups but Gas Stations Ytd vs 23 and Auto vs Apr 21. The lift for all big groups vs April 23 were all at least 20% below their 92>23 Average. Inflation is still a big factor. The rate for all commodities, the best pricing measure for Retail, fell from 0.6% to 0.3% but is 15.7% vs 21. There is more “real”, but not good news. In March, 7 measurements were “really” down vs 23 & 21 and 3 came from Gas Stations. In April, 6 were still really down – 2 from Gas Stations. Relevant Retail’s real monthly sales vs last year have now been positive for 10 straight months, but after 4 straight months of all positives, their real monthly sales vs 21 are down again.

Overall – Inflation Reality – For Total Retail, inflation slowed but real sales vs Apr 21 are still negative. For Restaurants, inflation remains high, +4.1% but they are really positive vs 23 & 21. Gas prices rose and that group is still in turmoil. Auto prices are down but still up 13.7% vs 21 which has slowed actual & real sales. Prices are slightly up for Relevant Retail and their monthly real sales are again down vs 21, after 4 months of all positives. Their progress is slowing.

Total Retail – Since June 20, every month but April 23 has set a monthly sales record. In 2023 Sales were on a roller coaster. Up in Jul>Aug, down in Sept, up in Oct>Dec, down in Jan 24, up in Feb>Mar, then down in April. Inflation fell and is only 0.3%. YOY sales growth is only 79% of the 92>23 avg. Sales are up 3.5% Ytd vs 2023, only 50% of their avg 19>24 growth. Monthly Real sales vs 21 are again negative and only 40% of the 19>24 growth is real. YOY inflation in Total Retail has significantly slowed but we see its cumulative impact. Growth: 23>24: 3.5%;Avg 19>24: +7.0%, Real: +3.0%.

Restaurants – They were hit hard by the pandemic and didn’t begin recovery until March 2021. However, they have had strong growth since then, setting an all-time monthly record of $96B in December 23 and exceeding $1T for the 1st time. They have the biggest Ytd increases vs 23, 21 & 19 and all real sales are positive. Inflation stayed at 4.1% in April but is still +20.8% vs 21 and +20.7% vs 19. 39.4% of their 51.5% growth since 19 is real and they remain 3rd in performance behind Relevant & Total. Recovery started late but inflation started early. Growth: 6.2%; Avg 19>24:+8.7%, Real: +3.8%. They just account for 13.6% of Total Retail $, but their performance improves the overall retail numbers.

Auto (Motor Vehicle & Parts Dealers) – They actively worked to overcome the stay-at-home attitude with great deals and a lot of advertising. They finished 2020 up 1% vs 2019 and hit a record $1.48T in 2021 but much of it was due to skyrocketing inflation. In 22, sales got on a rollercoaster. Inflation started to drop mid-year, but it caused 4 down months in actual sales which are the only reported sales negatives by any big group in 21>22. This is bad but their Y/E real 2022 sales numbers were much worse, down -8.2% vs 2021 and -8.9% vs 2019. 2023 was a true rollercoaster but the $ set a new record, $1.595T. $ fell in Jan 24, grew in Feb>Mar, then fell in Apr. Actual & real $ vs Apr 21 are negative plus real Ytd vs 21. Prices vs 23 are -2.7%. Only 22.5% of 19>24 growth is real. Growth: 2.6%; Avg 19>24: +5.9%, Real: +1.5%.

Gas Stations – Gas Stations were hit hard by “stay at home”. They started recovery in March 2021 and inflation began. Sales got on a rollercoaster in 2022 but reached a record $583B. Inflation started to slow in August and prices slightly deflated in Dec & Feb 23, then strongly fell in Mar>Jul to -20.2%. In August they rose to -3.7%. In Sep they were +2.7% but began deflating to -4.2% in Feb. In Mar/Apr they were +1.0%. $ are up vs Mar but down Ytd vs 23. Pricing is a factor in the $ drop vs 23 but real $ vs Apr 21 & Ytd vs 21 & 19 are also down. Growth: -0.8%; Avg 19>24: +5.1%, Real: -1.0%. They show the cumulative impact of inflation and demonstrate how deflation can be both a positive and a negative.

Relevant Retail – Less Auto, Gas and Restaurants – They account for ≈60% of Total Retail $ in a variety of channels, so they took many different paths through the pandemic. However, their only down month was April 2020, and they led the way in Total Retail’s recovery. Sales got on a roller coaster in 2022 but all months in 2022 set new records with December reaching a new all-time high, $481B, and an annual record of $4.81T. In 2023, the roller coaster continued. A December lift set a new monthly record of $494.7B and annual record of $4.997T. Sales fell in Jan>Feb 24 rose in Mar, then fell in Apr, which is normal. The -0.7% drop is 40% less than the 92>23 avg and the YOY lift of 3.8% is down 20% from avg. Also, monthly real sales vs 21 are again down after 4 straight months of all positives. However, 52% of their 42.5% 19>24 growth is real – #1 in performance. Growth: 3.8%; Avg 19>24: +7.3%, Real: +4.1%. This is where America shops. They finished 2023 and started up 2024 strong but in Mar>Apr their recovery may be slowing. This is concerning.

Inflation is still low, but the cumulative impact is still there. Sales increases are still small, which is very evident in April. It is also significant that there are 6 real drops vs 23 & 21, only down 1 from 7 in March. Restaurants are still doing well, but the Auto group and Gas Stations remain in turmoil. Although not as visible, the biggest concern is still with Relevant Retail. Sales increases are markedly lower and monthly real sales vs 21 are again negative after 4 months of all positives. Consumers are spending more $ and buying more product than in 23, but less than in 21. Progress has definitely slowed.

Here’s a more detailed look at April by Key Channels in the Stacked Bar Graph Format

  • Relevant Retail: Growth: +3.8%; Avg: +7.3%, Real: +4.1%. Only 3 were up from Mar. Vs Apr 23: 6 were up, Real: 5. Vs Apr 21: 6 were up, Real: 3. Vs 19: All were actually up. Only Dept Stores & Furnishing stores were really down.
  • All Dept Stores – This group was struggling before the pandemic hit them hard. They began recovery in March 2020. Sales are down -5.3% from March. Their actual $ are only up Ytd vs 21 & 19. Their real numbers are all negative. They are even really down -9.4% vs 2019. Growth: -2.4%; Avg 19>24: +0.04%, Real: -2.0%.
  • Club/SuprCtr/$- They fueled a big part of the recovery because they focus on value which has broad consumer appeal. $ales are -5.8% from March, but they are positive in all measurements except real vs Apr 21. However, only 45% of their 34.8% 19>24 lift is real – inflation’s impact. Note: Ytd growth is now below Avg. Growth: 4.3%; Avg: +6.1%, Real: +2.9%.
  • Grocery- These stores depend on frequent purchases, so except for the binge buying in 2020, their changes are usually less radical. Actual $ are -5.5% from March but up for all except vs Apr 23. However, cumulative inflation has hit them hard. Real $ are down vs 21 and only 8% of the growth since 2019 is real. Growth: 1.5%; Avg 19>24: +5.3%, Real: +0.5%.
  • Health/Drug Stores – Many stores are essential, but consumers visit less frequently than Grocery stores. $ are -2.7% from Mar. Actual $ are all up and real $ are only down vs Apr 23. Inflation has been low so 65% of their 25% growth from 2019 is real. Note: Their growth is again below the 19>24 avg. Growth: 2.9%; Avg 19>24: +4.6%, Real: +3.1%
  • Clothing and Accessories – Clothes initially mattered less when you stayed home. That changed in March 21 with strong growth through 2022. Sales are down -4.2% from March but positive in all comparisons but actual & real vs Apr 23 and real sales vs Apr 21. Plus, 63% of their 19>24 growth is real. Growth: 2.0%; Avg 19>24: +3.1%, Real:+2.0%
  • Home Furnishings – In mid-2020 consumers’ focus turned to their homes and furniture became a priority. Prices are still deflating but they were high in 2022. Sales are -6.4% from March and negative in all other measurements but actual Ytd sales vs 2019. They have sold less product in 2024 than 2019. Growth: -9.0%; Avg 19>24: +2.4%, Real: -0.4%
  • Electronic & Appliances – This channel has many problems. Sales fell in Apr>May of 2020 and didn’t reach 2019 levels until March 21. $ are down -4.4% from March. Actual $ are up vs Apr 23 & Ytd vs 21 & 19. Due to strong deflation, all real sales are positive. Note: Their growth is now below their Avg. Growth: -0.2%; Avg 19>24: +0.7%, Real: +3.4%.
  • Building Material, Farm & Garden & Hardware –They truly benefited from the consumers’ focus on home. In 2022 the lift slowed as inflation grew to double digits. Prices are still deflating, and sales are up 16.9% from March but they are only positive vs Apr 23 & Ytd vs 21 & 19. Prices are deflating but still 18.0% above 21 so real sales are negative monthly & Ytd vs 21. Also, just 23% of their 19>24 sales growth is real. Growth: -2.5%; Avg 19>24: +5.5%, Real: +1.4%.
  • Sporting Goods, Hobby and Book Stores – Consumers turned their attention to recreation and Sporting Goods stores sales took off. Book & Hobby Stores recovered more slowly. Actual sales are -6.8% from March and down for all but Ytd vs 2019. The only positive real sales measurements are Ytd vs 23 & 19. Their inflation rate has been lower than most groups so 71% of their 27.3% growth since 2019 is real. Growth: -2.3%; Avg 19>24: +4.9%, Real: +3.6%.
  • All Miscellaneous Stores – Pet Stores have been a key part of the strong and growing recovery of this group. They finished 2020 at +0.9% but sales took off in March 21 and have continued to grow. Sales are +4.1% vs March and are again positive in all measurements – actual & real. They are still 2nd to NonStore in the % increase vs 19 and vs 21. 70% of their 46% 19>24 growth is real but their current rate is still below Avg. Growth: +7.5%; Avg 19>24: +7.9%, Real: 5.7%.
  • NonStore Retailers – 90% of their $ comes from Internet/Mail Order/TV. The pandemic accelerated online spending. They ended 2020 +21.4%. The growth continued in 2021 as sales exceeded $100B for the 1st time and they broke the $1 Trillion barrier. $ are +2.0% from March. Their YOY lift grew to +12.8% in April but Ytd they are 35% below Avg. They are positive in all measurements and 81% of their 104% 19>24 growth is real. Growth: 10.1%; Avg: +15.4%, Real: +13.0%.

Note: Almost without exception, online sales by brick ‘n mortar retailers are recorded with their regular store sales.

Recap – The Retail recovery from the pandemic was largely driven by Relevant Retail and by the end of 2021 it had become very widespread. In 2022, there was a new challenge, the worst inflation in 40 years. Overall, inflation has slowed considerably from its June 22 peak and 7 channels are now deflating. This should help the Retail Situation. As expected, Sales fell from March. However, the drop was below average for many channels but he YOY monthly increase is also slowing. The 3.8% Relevant Retail lift vs Apr 23 was 20% below its 92>23 average 4.7% increase and 5 of 11 channels actually had a decrease. Among the 6 with increases, only NonStore & Misc. had double-digit lifts over 23. Inflation is low and now deflating in many channels. However, we are still seeing the impact of high cumulative inflation. Only a few channels are doing well. The slowing of the  YOY sales increase has become the biggest problem. In March, only SupCtr/Club/$ & Electronics had a Ytd lift above their 19>24 Avg. In April, there were none. Relevant Retail is really down Ytd vs 21 for the 2nd straight month, after 4 consecutive months of all positives. The recovery has definitely slowed.

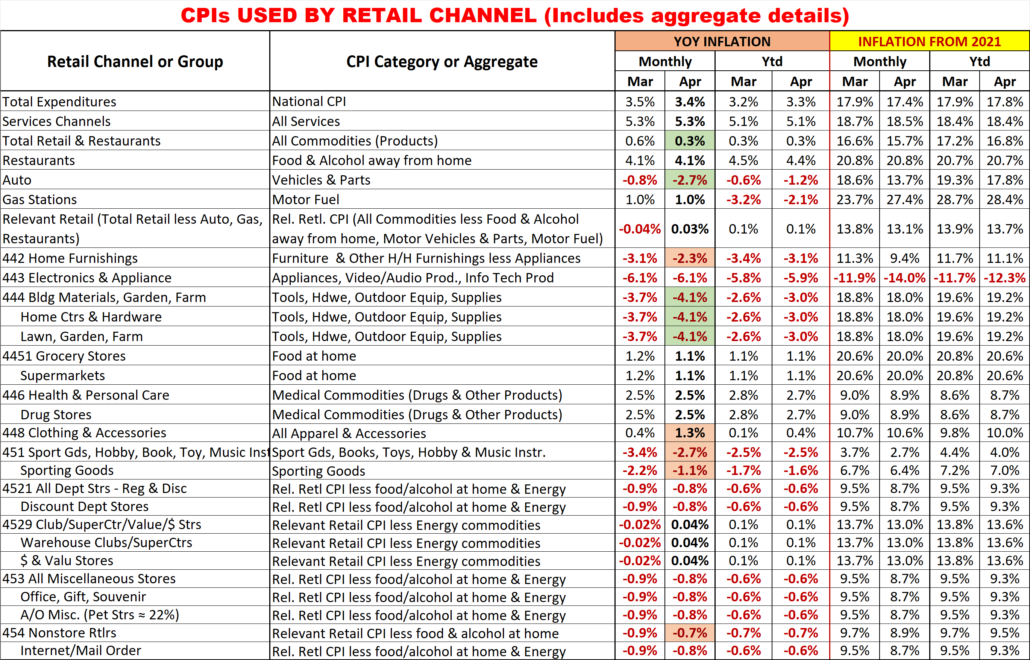
Finally, here are the details and updated inflation rates for the CPIs used to calculate the impact of inflation on retail groups and channels. This includes special aggregate CPIs created with the instruction and guidance of personnel from the US BLS. I also researched data from the last Economic Census to review the share of sales by product category for the various channels to help in selecting what expenditures to include in specific aggregates. Of course, none of these specially created aggregates are 100% accurate but they are much closer than the overall CPI or available aggregates. The data also includes the CPI changes since 2021 to show cumulative inflation.

Monthly YOY CPI changes of 0.2% or more are highlighted. (Green = lower; Pink = higher)

I’m sure that this list raises some questions. Here are some answers to some of the more obvious ones.

  1. Why is the group for Non-store different from the Internet?
    1. Non-store is not all internet. It also includes Fuel Oil Dealers, the non-motor fuel Energy Commodity.
  2. Why is there no Food at home included in Non-store or Internet?
    1. Online Grocery purchasing is becoming popular but almost all is from companies whose major business is brick ‘n mortar. These online sales are recorded under their primary channel.
  3. 6 Channels have the same CPI aggregate but represent a variety of business types.
    1. They also have a wide range of product types. Rather than try to build aggregates of a multitude of small expenditure categories, it seemed better to eliminate the biggest, influential groups that they don’t sell. This method is not perfect, but it is certainly closer than any existing aggregate.
  4. Why are Grocery and Supermarkets only tied to the Grocery CPI?
    1. According to the Economic Census, 76% of their sales comes from Grocery products. Grocery Products are the driver. The balance of their sales comes from a collection of a multitude of categories.
  5. What about Drug/Health Stores only being tied to Medical Commodities.
    1. An answer similar to the one for Grocery/Supermarkets. However, in this case Medical Commodities account for over 80% of these stores’ total sales.
  6. Why do SuperCtrs/Clubs and $ Stores have the same CPI?
    1. While the Big Stores sell much more fresh groceries, Groceries account for ¼ of $ Store sales. Both Channels generally offer most of the same product categories, but the actual product mix is different.

Petflation 2024 – April Update: Drops to +1.7% vs 2023

The monthly Consumer Price Index peaked back in June 2022 at 9.1% then began to slow until turning up in Jul/Aug 2023. Prices fell in Oct>Dec 23, then turned up Jan>Apr 24. However, the CPI slowed in April to +3.4% from +3.5% in March. Grocery prices rose 0.1% from March, but inflation slowed to 1.1% from 1.2% due to a 0.1% price lift in 23. After 12 straight months of double-digit YOY monthly increases, grocery inflation has now had 14 consecutive months below 10%. As we have learned, even minor price changes can affect consumer pet spending, especially in the discretionary pet segments, so we will continue to publish monthly reports to track petflation as it evolves in the market.

Petflation was +4.1% in December 2021 while the overall CPI was +7.0%. The gap narrowed as Petflation accelerated and reached 96.7% of the national rate in June 2022. National inflation has slowed considerably since June 2022, but Petflation generally increased until June 2023. It passed the National CPI in July 22, but at 1.7% in April, it is again below the national rate, -50%, a big change from +52% in January. We will look deeper into the data. The reports will include:

  • A rolling 24 month tracking of the CPI for all pet segments and the national CPI. The base number will be pre-pandemic December 2019 in this and future reports, which will facilitate comparisons.
  • Monthly comparisons of 24 vs 23 which will include Pet Segments and relevant Human spending categories. Plus
    1. CPI change from the previous month.
    2. Inflation changes for recent years (22>23, 21>22, 20>21, 19>20, 18>19)
    3. Total Inflation for the current month in 2024 vs 2019 and vs 2021 to see the full inflation surge.
    4. Average annual Year Over Year inflation rate from 2019 to 2024
  • YTD comparisons
    1. YTD numbers for the monthly comparisons #2>4 above

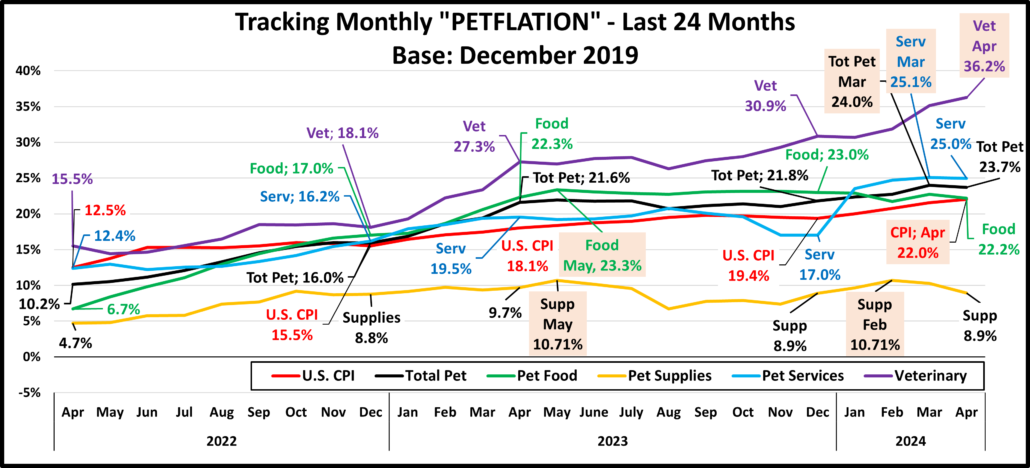
In our first graph we will track the monthly change in prices for the 24 months from April 22 to April 24. We will use December 2019 as a base number so we can track the progress from pre-pandemic times through an eventual recovery. This chart is designed to give you a visual image of the flow of pricing. You can see the similarities and differences in segment patterns and compare them to the overall U.S. CPI. The year-end numbers and those from 12 and 24 months earlier are included. We also included and highlighted (pink) the cumulative price peak for each segment. In April, Pet prices were down -0.2% from March. All but Veterinary were down, with Supplies leading the way, -1.2%.

In Apr 22, the CPI was +12.5% and Pet prices were +10.2%. Like the CPI, prices in the Services segments generally inflated after mid-2020, while Product inflation stayed low until late 21. In 22 Petflation surged. Food prices consistently grew but the other segments had mixed patterns until July 22, when all increased. In Aug>Oct Petflation took off. In Nov>Dec, Services & Food prices continued to grow while Vet & Supplies prices stabilized. In Jan>Apr 23, prices grew every month except for 1 dip by Supplies. In May Products prices grew while Services slowed. In Jun/Jul this reversed. In August all but Services fell. In Sep/Oct this was reversed. In Nov, all but Food & Vet fell. In Dec, Supplies & Vet  drove prices up. In Jan>Mar 24 Pet prices grew despite a few drops from all but Services. In April, prices in all but Vet fell.

  • U.S. CPI – The inflation rate was below 2% through 2020. It turned up in January 21 and continued to grow until flattening out in Jul>Dec 22. Prices turned up Jan>Sep, dipped in Oct>Dec, rose Jan>Mar, then fell in Apr, but 31% of the 22.0% increase in the 52 months since Dec 2019 happened from Jan>Jun 2022 – 11.5% of the time.
  • Pet Food – Prices were at or below Dec 19 levels from Apr 20>Sep 21. They turned up, peaking in May 23. In Jun>Aug they dipped, grew Sep>Nov, fell Dec>Feb, rose in Mar, fell in Apr. 96% of the 22.2% lift came in 22 & 23.
  • Pet Supplies – Supplies prices were high in Dec 19 due to tariffs. They then had a “deflated” roller coaster ride until mid-21 when they returned to Dec 19 prices and essentially stayed there until 22. They turned up in Jan and hit an all-time high, beating the 2009 record. They plateaued Feb>May, grew in June, flattened in July, then turned up in Aug>Oct setting a new record. Prices stabilized in Nov>Dec but grew in Jan>Feb 23. They fell in Mar, but set a new record in May, then continued the rollercoaster ride with a drops in Mar/Apr, after Dec>Feb lifts.
  • Pet Services– Normally inflation is 2+%. Perhaps due to closures, prices increased at a lower rate in 2020. In 2021 consumer demand increased but there were fewer outlets. Inflation grew in 2021 with the biggest lift in Jan>Apr. Inflation was stronger in 2022 but prices got on a rollercoaster in Mar>Jun. They turned up Jul 22>Mar 23 but the increase slowed in April and prices fell in May. They rose Jun>Aug, fell in Sep>Dec, rose Jan>Mar, then fell in Apr.
  • Veterinary – Inflation has been consistent. Prices turned up in Mar 20 and grew through 21. A surge began in Dec 21 which put them above the overall CPI. In May 22 prices fell and stabilized in June causing them to fall below the National CPI. However, prices rose again and despite some dips they have stayed above the CPI since July 22. In 23, prices grew Jan>May, stabilized Jun/Jul, fell in Aug, grew Sep>Dec, fell in Jan 24, but set records in Feb>Apr.
  • Total Pet – Petflation is a sum of the segments. In Dec 21 the price surge began. In Mar>Jun 22 the segments had ups & downs, but Petflation grew again from Jul>Nov. It slowed in Dec, grew Jan>May 23 (peak), fell Jun>Aug, grew in Sep/Oct, then fell in Nov. In December prices turned up and grew through March to a new record high. Prices fell in April and Petflation is again below the National CPI for the first time since Nov 22.

Next, we’ll turn our attention to the Year Over Year inflation rate change for April and compare it to last month, last year and to previous years. We will also show total inflation from 21>24 & 19>24. Petflation fell to 1.7%, down from 3.8% in March. It is now 50% below the National rate. In January, it was +52%. The chart will allow you to compare the inflation rates of 23>24 to 22>23 and other years but also see how much of the total inflation since 2019 came from the current pricing surge. We’ve included some human categories to put the pet numbers into perspective.

Overall, Prices were +0.4% from March but were +3.4% vs April 23, down from +3.5% last month because there was a bigger Mar>Apr price lift in 23. Grocery inflation also fell slightly to +1.1% from +1.2%. 4 of 9 categories had a price decrease from last month – all Pet. There were only 2 in Jan>Mar. The national YOY monthly CPI rate of 3.4% is down and just 69% of the 22>23 rate and 41% of 21>22. The 23>24 inflation rate is below 22>23 for all categories but Medical Services. In our 2021>2024 measurement you also can see that over 65% of the cumulative inflation since 2019 occurred in all but 2 segments – Medical Services & Haircuts – both Services categories. Service Segments have generally had higher inflation rates so there was a smaller pricing lift in the recent surge. Pet Products have a very different pattern. The 21>24 inflation surge provided 97% of their overall inflation since 2019. This happened because Pet Products prices in 2021 were just starting to recover from a deflationary period. Services expenditures now account for 64.1% of the National CPI so they are very influential. Their current CPI is +5.3% while the CPI for Commodities is +0.3%. This clearly shows that Services are driving almost all of the current 3.4% inflation rate.

  • U.S. CPI– Prices are +0.4% from March. The YOY increase is 3.4%, down from 3.5%. It peaked at +9.1% back in June 2022. The targeted inflation rate is <2% so we are still 70% higher than the target. After 12 straight declines, we had 2 lifts, a stable month, 2 consecutive drops, now 2 of 5 with drops – still not good! The current rate is 31% below 22>23 but the 21>24 rate is still 17.4%, 76.7% of the total inflation since 2019. Inflation was low in early 2021.
  • Pet Food– Prices are -0.5% vs March and -0.1% vs April 23, down from +1.8%. Now, they are significantly below the Food at Home inflation rate, +1.1%. The YOY drop of -0.1% is being measured against a time when prices were 22.3% above the 2019 level and the current decrease is now below the -0.02% drop from 2020 to 2021. The 2021>2024 inflation surge has generated 94.1% of the total 23.9% inflation since 2019.
  • Food at Home – Prices are up +0.1% from March, but the monthly YOY increase is 1.1%, down from 1.2% last month. It is radically lower than Jul>Sep 2022 when it exceeded 13%. The 26.4% Inflation for this category since 2019 is 16% more than the national CPI but fell to 4th place behind 3 Services expenditures. 75.8% of the inflation since 2019 occurred from 2021>24. This mirrors the national CPI, but we should note that Grocery prices began inflating in 2020>21 then the rate accelerated. It appears that the pandemic supply chain issues in Food which contributed to higher prices started early and foreshadowed problems in other categories and the overall CPI tsunami.
  • Pets & Supplies– Prices were down -1.2% from March and -0.7% vs April 2023. They have the lowest increase since 2019. As we noted, prices were deflated for much of 2021. As a result, the 2021>24 inflation surge accounted for 100+% of the total price increase since 2019. They reached an all-time high in October 2022 then prices deflated. 3 months of increases pushed them to a new record high in Feb 23. Prices fell in March, bounced back in Apr/May to a new record high, fell in Jun>Aug, grew in Sep>Oct, fell in Nov, grew again in Dec>Feb, then fell in Mar>Apr.
  • Veterinary Services– Prices are +0.8% from March and +7.1% from 2023, still the highest rate in the Pet Industry. Plus, they are the leader in the increase since 2019 with +39.9% and since 2021, +29.5%. For Veterinary, relatively high annual inflation is the norm. However, the rate has increased during the current surge, especially in 22 & 23. It is still high in 24, so 73.9% of the cumulative inflation since 2019 occurred from 2021>24.
  • Medical Services – Prices turned sharply up at the start of the pandemic but then inflation slowed and fell to a low rate in 20>21. Prices grew 3% from March, and they are +2.7% vs last year. Medical Services are not a big part of the current surge as only 43% of the 15.3% 2019>24 increase happened from 21>24.
  • Pet Services – Inflation slowed in 2020 but began to grow in 2021. In 2024 prices surged to a record high before dropping in April but are still +4.5% vs last year. Inflation peaked at +8.0% back in March 23. Now, 65% of their total 19>24 inflation has occurred since 2021. In December, it was only 49%. BTW: They have the 2nd highest 19>24 rate.
  • Haircuts/Other Personal Services – Prices are +1.2% from March and +4.7% from 23. 2 of the last 4 months have been 4.0+%. Inflation has slowed but has been pretty consistent. 59% of the 19>24 inflation happened 21>24.
  • Total Pet– Petflation fell to 1.7% from 3.8% in March and is now 90% less than the 22>23 rate and 50% less than the U.S. CPI. For April, 1.7% is 45% below the 3.1% average rate since 1997. Vs March, prices fell -0.2% as all but Veterinary had drops. Vet was +0.8%. A Mar>Apr price drop has only happened in 3 of the last 27 years, all since 2015, so this month’s data was somewhat surprising. In terms of Petflation, 2024 appears to be returning to a more normal pattern. However, the path to get there may be unusual and there is still a ways to go.

Now, let’s look at the YTD numbers.

The inflation rate for 22>23 was the highest for 4 of 9 categories – All Pet – Pet Food, Services, Veterinary & Total Pet. The 23>24 rate is usually much lower than 22>23 for all but Medical Services, where they are tied. 21>22 still has the highest rate for Food at Home, the CPI & Pet Supplies. The average annual national inflation in the 5 years since 2019  is 4.2%. Only 2 of the categories are below that rate – Medical Services (2.8%) and Pet Supplies (2.2%). It comes as no surprise that Veterinary Services has the highest average rate (6.6%), but all 5 other categories are +4.6% or higher.

  • U.S. CPI – The 23>24 rate is 3.3%, up from 3.2% in March, but down 41% from 22>23 and 59% less than 21>22. It is also 21% below the average YOY increase from 2019>2024, but it’s still 68% more than the average annual increase from 2018>2021. 78% of the 22.7% inflation since 2019 occurred from 2021>24. Inflation is a big problem that started recently.
  • Pet Food – Ytd inflation is 2.2%, down from 3.0% in March and 85% less than the 22>23 rate. Now, it is also 54% lower than 21>22 and only 16% above the average rate from 2018>2020. Pet Food has the highest 22>23 rate on the chart and remains in 2nd place in the 21>24 rates. Deflation in the 1st half of 2021 kept YTD prices low then prices surged in 2022 and especially in 2023. 92% of the inflation since 2019 occurred from 2021>24.
  • Food at Home – The inflation rate has slowed remarkably. At 1.1%, it is down 88% from 22>23 & 21>22 and 62% from 20>21. Also, it is now 19% lower than the average rate from 2018>20. It remains in 3rd place for the highest inflation since 2019 but still beat the U.S. CPI by 15%. You can see the impact of supply chain issues on the Grocery category as 79% of the inflation since 2019 occurred from 2021>24.
  • Pets & Pet Supplies – Prices increased in Jan & Feb, then fell in Mar & Apr and the 2024 inflation rate of 0.4% is only higher than the -2.2% deflation in 20>21. Supplies have the lowest inflation since 2019. The only significant increases were 7.0% in 22 & 5.4% in 23. The 2021 deflation created a unique situation. Prices are up 11.7% from 2019 but 113% of this increase happened from 2021>24. Prices are up 13.2% from their 2021 “bottom”.
  • Veterinary Services – Inflation was high in 2019 and steadily grew until it took off in late 2022. It may have peaked in 2023, but is still going strong at the start of 2024, +8.5%, the highest on the chart. They are also #1 in inflation since 2019 and since 2021. At +6.6%, they have the highest average annual inflation rate since 2019. It is 1.6 times higher than the National Average but 2.4 times higher than the Inflation average for Medical Services. Strong Inflation is the norm in Veterinary Services.
  • Medical Services – Prices went up significantly at the beginning of the pandemic, but inflation slowed in 2021. Ytd it is 1.6%. In a non-pandemic year, “normal” is between 2.1>2.9%. We are still seeing the impact of 2023 when prices actually deflated (-0.3%). This was the only deflationary year since the US BLS began tracking this category in 1935.
  • Pet Services – After falling in late 2023, prices surged in 2024 until April. The Ytd 23>24 inflation rate of 4.8% is 2nd to Veterinary in the Pet Industry. It is 37% less than 22>23 and 16% below 21>22. However, it is still 1.4 times higher than the 2018>21 average rate. Pet Services is 2nd in 19>24 inflation but only 5th in inflation since 2021.
  • Haircuts & Personal Services – The services segments, essential & non-essential, were hit hardest by the pandemic. The industry responded by raising prices. Ytd inflation is 4.1%, which is 29% below the 20>21 peak but 55% above the 18>20 average. Consumers are paying over 25% more than in 2019, which usually reduces the frequency.
  • Total Pet – Ytd Petflation is 3.4%, down from 4.0%. It is 67% less than 22>23 but 48% higher than the 2018>21 average rate. It is also still 3% above the national CPI. Petflation is slowing in 2024. This is primarily being driven by drops in Pet Food inflation rates but Supplies inflation is also slowing. Services prices dropped in April after a record high in March. Vet inflation slowed in April, but prices hit a record high. It was not enough to overcome the drops.

Petflation is definitely slowing. April was 45% below the average for the month and 50% lower than the National CPI. This is the same as it was back In 2021. One fact is often ignored in the headlines – Inflation is cumulative. Pet prices are 21.4% above 2021 and 26.1% higher than 2019. Those are big lifts. In fact, in April prices for Vet hit a new record. Total Pet & Services are only 0.2% below the highest in history. Food prices are 1% below their peak and Supplies prices are 1.6% lower. Only Supplies prices (+10.4%) are less than 26.4% higher than 2019. Since price/value is the biggest driver in consumer spending, inflation will affect the Pet Industry. Non-Vet Services will be the least impacted as it is driven by high income CUs. Veterinary will likely see a reduction in visit frequency. The product segments will see a more complex reaction. Supplies will likely see a reduction in purchase frequency and some Pet Parents may even downgrade their Pet Food. Products will see a strong movement to online purchasing and private label. We saw evidence of this at GPE 24 where a record number of exhibitors offered OEM services. Strong, cumulative inflation has a widespread impact.

The Retail Market – Evolution 1992 > 2023

All aspects of the world are constantly changing. The Retail Marketplace is no exception as retailers try to meet the evolving wants and needs of consumers. When I was growing up, Traditional Department Stores and Brand-named products “ruled” the Retail Market. Now, the focus is on value (quality + price) and convenience so the Internet and the big “1 stop shopping” outlets like Warehouse Clubs, SuperCenters and Home Centers dominate the market. Plus, even smaller chain stores now offer a variety of private label products.

Total Retail grew from $2.0T in 1992 to $8.3T in 2023, a 312% increase – over 4 times more $ were spent. In this report we will try to identify the specific changes in the Retail Market from 1992 to 2023 that drove the increase. Some channels rose to prominence while others fell. The primary source of the data is the Census Bureau’s Monthly Retail Trade Report. This evolution report is long and complex. We will start with the Big Retail Groups then ultimately drill down to the individual channel level. The final results are relatively simple but the journey to our goal is very complicated. To make it easier for you to understand, I have created and included 38 graphs and charts so you can literally “see” the details of the 1992>2023 Retail Evolution. It will also reduce the amount of comments. We should also note that the data is in actual $. Inflation can certainly impact consumer spending, but we will focus on the amount spent. FYI – The CPI increased 117% from 1992>2023 and Commodities prices grew by 73.1% so Total Retail only had a 138% lift in the amount of product sold 92>23. Services were the overwhelming “leader” in raising prices – +153%.

Let’s get started. Our first two pie charts show the Total Retail market share for the Big Groups – Restaurants, Auto, Gas Stations and Relevant Retail in 1992 and 2023.

The 2 charts look very similar. There was no change in share for Gas Stations. Restaurants were the only group to gain share, +3.1%. I’m sure that a 150+% increase in prices was a big factor. The Auto group lost -1.7% but the big surprise was Relevant Retail losing -1.5%. They are now 59.9% but still slightly above their 92>23 average of 59.8%. This is rather calm. Let’s look at the cumulative growth by year in a line graph.

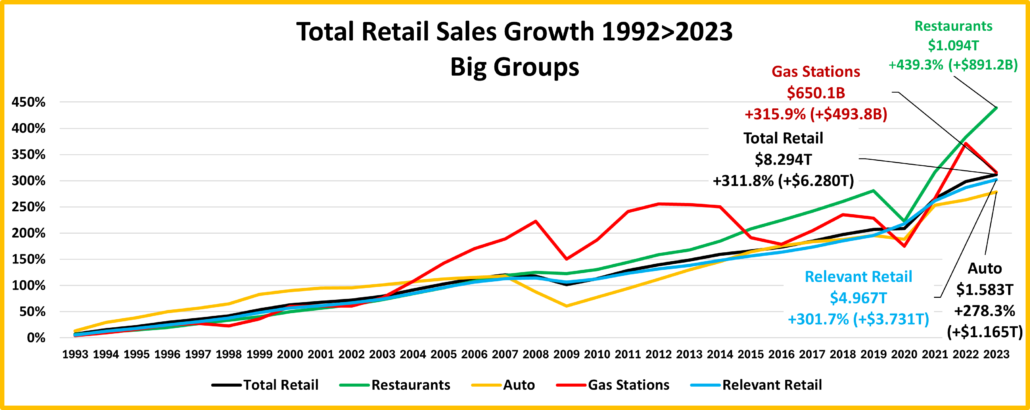
The first thing that you notice is that there are 2 big negative events – the Great Recession which hit bottom in 2009 and the 2020 Pandemic. The Recession drove sales down in all big groups. Auto was actually down in both 2008 & 2009. Their drop in 2008 was large enough to drive Total Retail down for that year too. Auto didn’t return to the sales level of 2007 until 2013. Gas Stations had a huge drop in 2009 but they recovered by 2011. Relevant Retail had a small drop. They almost recovered in 2010 but didn’t officially exceed 2008 sales until 2011. BTW, this was their only annual sales decrease since 1992. Restaurants had a miniscule drop and were back on track in 2010. As noted, sales in Total Retail were down in both 2008 & 2009. They fully recovered in 2011.

Now, the 2020 Pandemic. Sales decreased in Restaurants, Auto and Gas Stations but the lift in Relevant Retail was large enough to keep Total Retail slightly positive. Due to the “stay at home” attitude, the drops in Restaurants and Gas Stations were huge but all groups had recovered by 2021. Here are some 1992>2023 specifics.

Total Retail – 2023 sales = $8.294T; growth from 1992: +$6.280T (+311.8%); avg growth: +4.6%. They only had 2 annual decreases, in 2008 & 2009. The biggest drop was -7.4% in 2009. Their biggest lift was +18.4% in 2021.

Restaurants – 2023 sales = $1.094T; growth from 1992: +$891.2B (+493.3%); avg growth: +5.6%. They also have had only 2 drops, in 2009 & 2020. The biggest drop was -15.3% in 2020. Their biggest increase was +29.1% in 2021.

Auto – 2023 sales = $1.583T; growth from 1992: +$1.165T (+278.3%); avg growth: +4.4%. They have had 3 down years, in 2008, 2009 & 2020. The worst was -14.5% in 2009. Their best year was +22.5% in 2021.

Gas Stations – 2023 sales = $650.1B; growth from 1992: +$493.8B (+315.9%); avg growth: +4.7%. As you can see on the chart, their sales have been on an up/down roller coaster ride for the last 20 years. Interestingly enough, in 2023 they are at about the same level as they would have been if they had just maintained their 1992>2003 growth rate. They’ve had 10 down years, the worst was -22.3% in 2009 but 4 drops, including 23 were over 10%. Their best year was +33.4% in 2021 but 10 were in double digits. Prices are up 216% since 1992, with big fluctuations, which explains the rollercoaster.

Relevant Retail (Less Restaurants, Auto & Gas) – 2023 sales = $4.967T; growth from 1992: +$3.731T (+301.7%); avg growth: +4.6%. As we noted, their only down year was 2009, -3.6%. In fact, they only had one other year below +2.0% –  +0.5% in 2008. Their best year was +13.7% in 2021 and was the only year that their increase exceeded 10%. They are the epitome of consistency. Their share of Total Retail has been 59>59.9% in all but 7 years. In those years, it ranged from 60.2% in 2008 to 63.2% in 2020. Two of the 60+ years were 1992>93 at the start of our analysis, but five – 2008>10 & 2020>21 occurred when the country was in crisis. Relevant Retail includes a variety of channels that often have a radically different reaction to trends and outside influences. However, they always manage to “unite” to produce consistent growth for this big group.

In our next analytical step, we will begin to drill down into Relevant Retail to see the specifics behind the consistent growth in the largest member of the Big Groups. It is the area of most interest to the CPG industry. We start with pie charts showing the 1992 & 2023 share of dollars of the large channel Subgroups.

Unlike Total Pet, you immediately see a major difference in the 2 charts. With a 21.1% increase in share, NonStore moved up from #7 to #1. All other subgroups but Health & Drug loss share. The biggest decrease was -10.3% by Food & Beverage, the former leader. The smallest drop was -0.6% by Building Materials/Farm. Obviously, this deserves a closer look. We will turn to line charts covering 1992>2023 sales. To make them easier to read, they are divided into 3 groups based on the % size of their 92>23 increase. We will start with the lowest performers and work our way to the top.

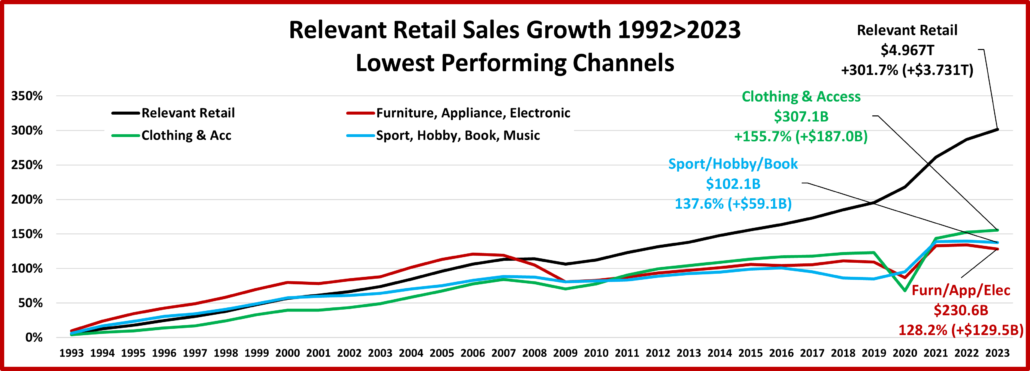
With some slight variations, all 3 had a very similar pattern. They also more than doubled their sales but that was significantly below the overall quadrupling by Relevant Retail.

Furniture, Appliances & Electronics – $230.6B; +$129.5B (+128.2%); avg: +2.7%. They had the biggest Recession drop, -17.5% which started in 2008. They actually didn’t recover to the 2007 level until the 24.9% lift in 2021, after the 2020, -10.8% COVID drop.

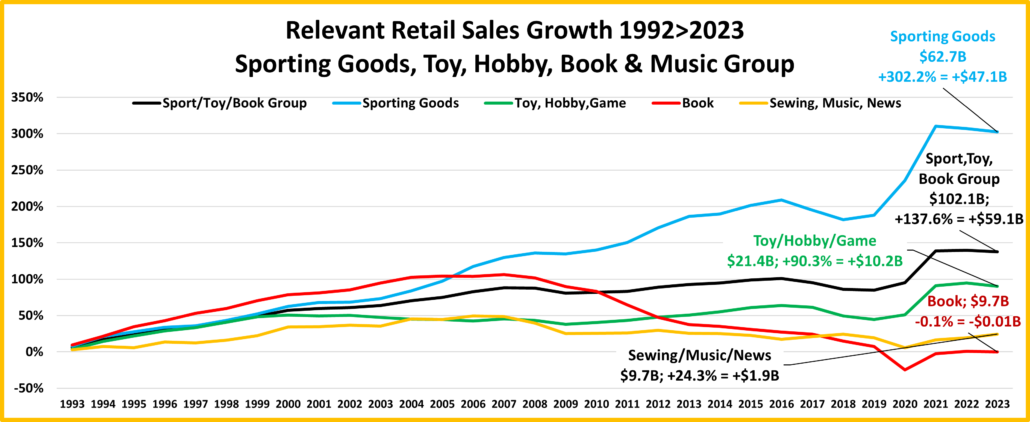
Sport, Book, Hobby, Music – $102.1B; +59.1B (+137.6%); avg: +2.8%. They had the smallest Recession drop and sales were down before COVID. They actually grew in 2020. Worst year: 2018 (-4.7%); Best year: 2021 (+22.5%).

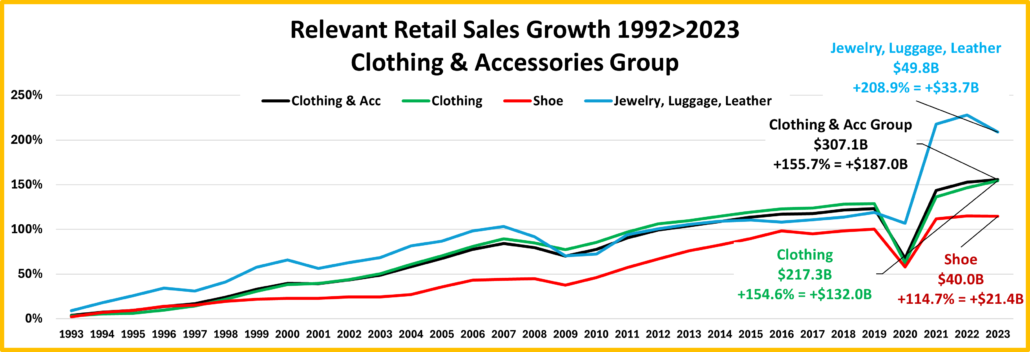
Clothing & Access – $307.1B; +$187.0B (+155.7%); avg: +3.1%. They had drops in 2008>09 & 2020 but quickly recovered. Worst year: 2020 (-24.8%); Best year 2021 (+45.1%).

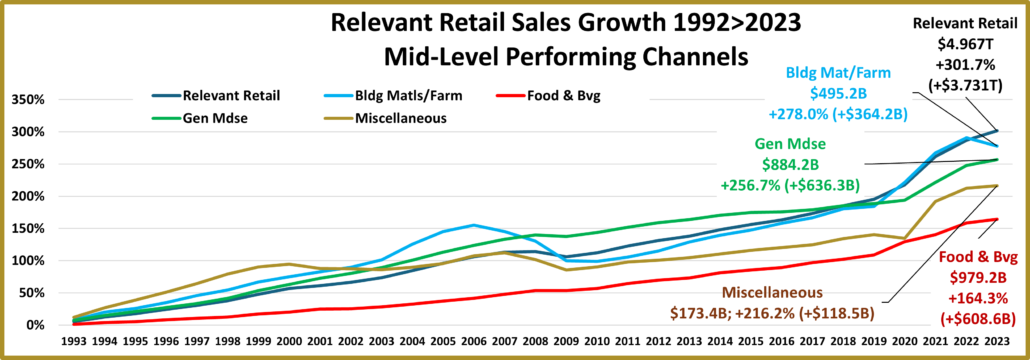
You see some distinct differences in the patterns of this mid-level group. While their 1992>2023 increases were all below Relevant Retail, all Subgroups except Food & Beverage at least tripled their sales vs 1992.

Food & Beverage – $979.2B; +$608.6B (+164.3%); avg: +3.2%. They have had relatively low growth, but it has been very consistent. They had only 1 down year, 2009 and the drop was small, -0.2%. Their biggest lift was +9.3% in 2020. Their growth accelerated from 2020>2023. This was primarily due to 2 factors – the move to eat at home and strong inflation.

Miscellaneous Stores (includes Pet) – $173.4B; +$118.5B (+216.2%); avg: +3.8%. They had drops in 2001>03, 2008>09 & 2020. The biggest decrease was -8.1% in 2009 and they didn’t recover to the 2007 level until 2015. The 2020 drop was a different story. They recovered immediately in 2021 with the biggest lift in history, +24.2%. This was their first double digit lift since +12.9% in 1994. Growth slowed markedly to +1.2% in 2023.

General Mdse – $884.2B; +$636.3B (+256.7%); avg: +4.2%. Although their growth is bigger, they have a pattern very similar to Food & Bvg. They have only 1 drop. It also occurred in 2009 and was minor, -1.0%. They also had no double digit increases but their biggest lift was in 2021, +9.4%, not 2020 and their growth after COVID was a little stronger.

Building Material/Farm – $495.2B; +$364.2B (+278.0%); avg: +4.4%. Their pattern was very different. Sales fell from 2007 through 2010 and also in 2023. The biggest drop was -13.3% in 2009. Plus, their growth accelerated in 2020 and continued through 2022. The biggest lift was +14.3% in 2021 but 2020 was 2nd with +13.0%. Now, the top performers…
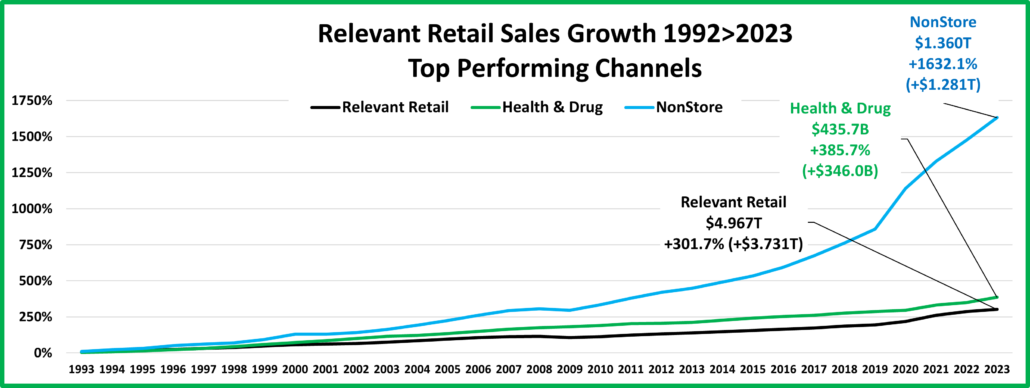
As you can see, there were only 2 Subgroups whose growth exceeded Relevant Retail – Health/Drug & NonStore. While Health/Drug had consistent growth, NonStore accelerated in 2010 and then skyrocketed in 2020.

Health & Drug – $435.7B; +$346.0B (+385.7%); avg: +5.2%. Their growth was definitely consistent as they were the only Subgroup with no decreases in sales. Their smallest lift was +0.9% in 2012. They only had 1 double digit increase, +10.1% in 1999. Sales did increase +9.0% in 2021 & +8.1% in 2023 but their strongest growth was 1996>2003 – avg: +8.3%.

NonStore – $1.360T; +$1.281T (+1632.1%); avg: +9.6%. Their spectacular growth is obviously being driven by the internet. They did have 1 down year, -2.5% in 2009. Sales took off in 2010 then exploded with a 29.3% lift in 2020. Every year 2017>2023 had a double-digit increase. Consumers seek value & convenience, which is the internet game plan.

The next pie chart shows each Subgroup’s share of Relevant Retail’s total growth. If you divide the share of growth by the share of 1992 sales you get a measure of performance. The bar graph allows you to compare the results.

As expected, NonStore drove the growth and their performance was “off the chart”. Performance must exceed 100% for a group to “earn its share”. Only NonStore and Health/Drug exceeded 100%. All others underperformed. This is interesting but not really usable. We must “drill down” to the channel level to find out what is really happening in Retail. We will do that by analyzing key channels within the Subgroups, starting with Furniture, Appliance & Electronics stores.

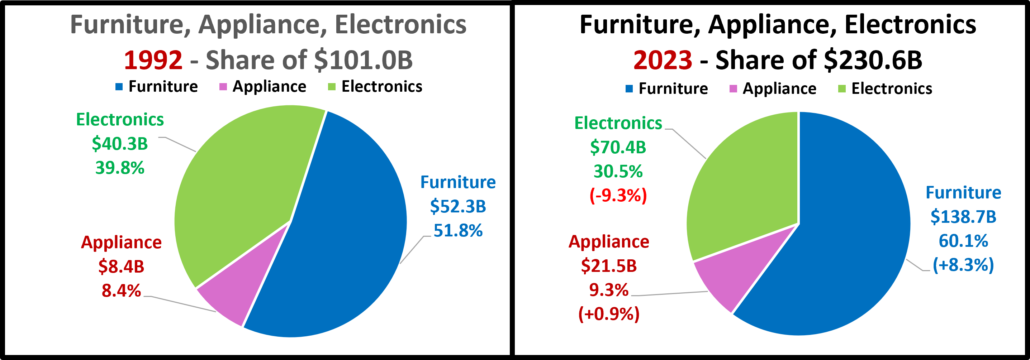
The Subgroup loss 3.6% share of Relevant Retail. Within the subgroup, Electronics lost almost 25% of its share of group $. Most was picked up by Furniture but a little by Appliances. Let’s look at their cumulative growth by year in a line graph.

All had big drops in 2009 but Appliance sales increased in 2020. They have similar patterns but with some differences.

Relevant Retail: +301.7% Furniture, Appliance, Electronics Subgroup: 128.2%

Electronics – $70.4B; +$30.2B (+74.9%); avg: +1.8%; They had strong consistent growth through 2007. Since then, they have been on a rollercoaster but trending down from their 2007 peak. Biggest Chges – ↑: 2021: +28.8%; ↓: 2020: -23.5%

Appliance – $21.5B; +$13.1B (+154.8%); avg: +3.1%; They had a big 2008 & 2009 recession drop but sales actually grew in 2020 and after, until dropping in 2023. Biggest Changes – ↑: 2021: +16.5%; ↓: 2009: -10.0%

Furniture – $138.7B; +86.3B (+164.9%); avg: +3.2%; $ dropped 2007>2009, 2020 & 2023. The biggest decrease was -14.2% in 2009. In 2007 their growth fell below the subgroup. They have exceeded it 2016>23. Biggest lift – 2021: +24.3%

Building Material/Farm

The Subgroup lost only -0.6% share of Relevant Retail $. Within the Subgroup, Homecenters “rule” and only they gained share, +5.9%. The drops were pretty balanced, ranging from -1.5% for Hardware to -2.2% for Farm and Paint/Wallpaper.

Homecenters obviously drive the Subgroup’s business. Sales for all channels fell during the recession but grew in the pandemic as consumers focused on “home”.

Relevant Retail: +301.7%     Building Materials/Farm Subgroup: 278.0%

Paint/Wallpaper – $17.2B; +$9.7B (+129.3%); avg: +2.7%; They had a long 2007>2009 drop. The biggest decrease was in 2009, -15.5%. They didn’t recover until 2015. Their biggest lift was +10.8% in 2005 but 2022 was a close 2nd, +10.3%.

Hardware – $40.8B; +$28.1B (+221.9%); avg: +3.8%; Their recession decrease was 2008>2009 with the biggest drop in 2009, -7.0%. They recovered in 2012. They’ve only had 3 drops since 92 but they’ve only had 1 10+% lift, +20.4% in 2020.

Farm – $67.4B; +$46.7B (+226.0%); avg: +3.9%; They have had 4 occasional 1 year decreases. The biggest was -11.8% in 2009. Their largest lift was +18.6% in 2021, which surpassed +16.7% in 2020.

Homecenters – $369.8B; +279.6B (+310.2%); avg: +4.7%; Their growth slightly exceeded Relevant Retail, so they gained share. They have always led the group in cumulative growth. They’ve only had 5 drops – 2007>10 & 2023. The biggest decrease was -13.3% in 2009. Their 2 biggest increases were +14.3% in 2021, which beat +13.0% in 2020.

Food & Beverage

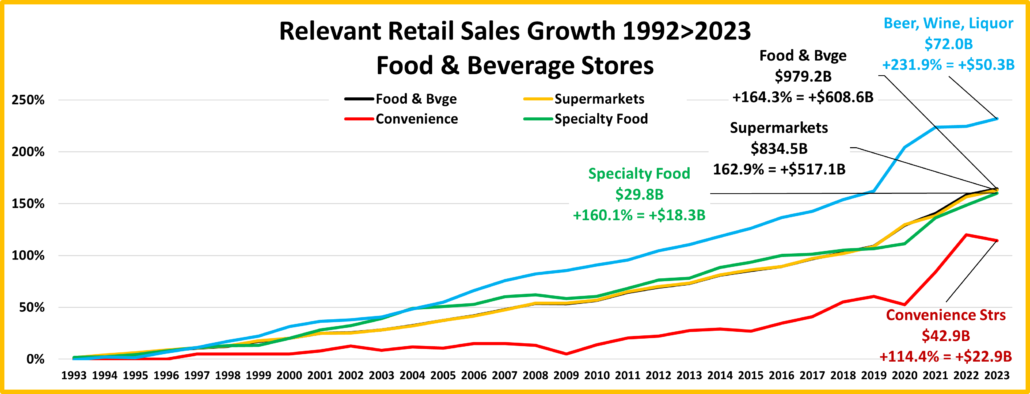
Food & Bvg was the biggest loser in share of Relevant Retail, -10.3%. Within the Subgroup there was little change. Supermarkets still have 85% of the $. However, Alcohol Stores were the only channel that gained share, +1.5%.

The Subgroup has shown consistent growth with only 1 down year, -0.2% in 2009. Alcohol Stores have been the growth leader since 2006. Only Convenience Stores have had a lot of fluctuations. The others have very consistent patterns.

Relevant Retail: +301.7%     Food & Beverage Subgroup: 164.3%

Convenience Stores – $42.9B; +$22.9B (114.4%); avg: +2.5%; There have been a lot of ups & downs since 2001 with 8 drops. One lasted from 2007>09. The biggest were 2009: -7.4%; 2020: -5.0%. The biggest lifts: 2021: 20.6%; 2022: 19.6%.

Specialty Food – $29.8B; +$18.3B (+160.1%); avg: +3.1%; They have had slow, but consistent growth with only 1 down year, -2.2% in 2009. Their big COVID lift, +11.7% didn’t happen until 2021 but strong growth continued through 2023.

Supermarkets – $834.5B; +$517.1B (+162.9%); avg: +3.2%; Although they have lost a big share of Relevant Retail $, their growth has been very consistent. They have had no decreases since 1992. Their smallest increase was +0.1% in 2009. As expected, their biggest lift occurred in 2020, +10.1%. It was their only double-digit increase.

Beer, Wine & Liquor – $72.0B; +$50.3B (+231.9%); avg: +3.9%; Their growth is 42% more than Supermarkets. It has also been consistent with drops in only 1993 (-0.7%) & 1995 (-0.5%). Their biggest & only double-digit lift was +16.1% in 2020.

Health & Drug Subgroup

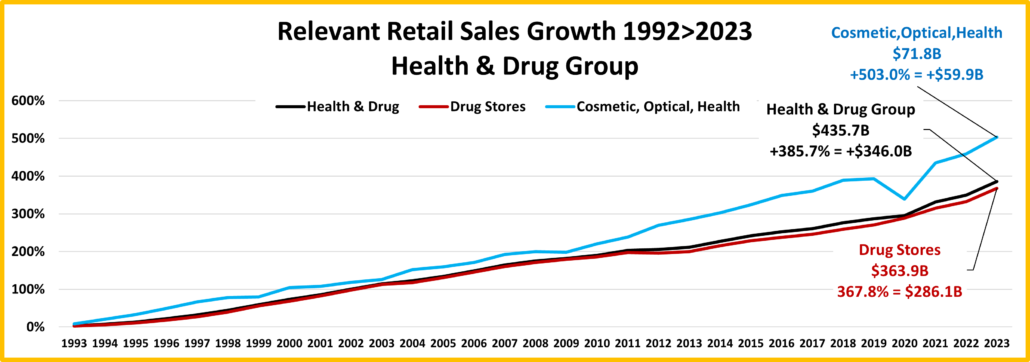
Health/Drug gained 1.5% in share of Relevant Retail. NonStore had the biggest gain and was the only other Subgroup to gain share. Drug had a big sales increase but their share of $ within the Subgroup actually decreased by -3.2%.

The Subgroup has shown consistent, above average growth, +5.2%. They have had no down years, but only 1 year with a double digit increase, +10.1% in 1999. Non-Drug Store $ took a big dive in 2020, but it had little impact on the Subgroup.

Relevant Retail: +301.7%     Health & Drug Subgroup: +385.3%

Cosmetic, Optical, Health – $71.8B; +$59.9B (503.0%); avg: +6.0%; Except for a small drop in 2009 and a big one in 2020, -11.0% they have had steady growth. It has accelerated since 2010. The biggest lift, +22.0%, was in their 2021 recovery.

Drug – $363B; +$286.1B (+367.8%); avg: +5.1%; They have had only 1 down year, -0.6% in 2012.  Their biggest lift and only double-digit increase, +11.9% occurred back in 1999. Obviously, Drug “rules” this Subgroup but the lift is somewhat deceptive. Actual Drug Stores, both chain and independent have been struggling recently as a huge number of Grocery & General Mdse stores have added a pharmacy within the store and online pharmacies have become a major force. The online only companies are still classified as Drug Stores, even though they have no physical outlets.

Clothing & Accessories

The Clothing & Acc. Subgroup’s share of Relevant Retail $ fell from 9.7% to 6.2%, a 36% drop. Within the Subgroup, only Jewelry, Luggage, Leather gained share. Shoes’ share fell -2.5% but the big Clothing channel only lost -0.3%.

All channels have a similar pattern, with Recession & COVID drops. Clothing is definitely the driving force. This is very apparent as the sales pattern of the Subgroup almost exactly matches the pattern of Clothing.

Relevant Retail: +301.7%     Clothing & Accessories Subgroup: +155.7%

Shoe Stores – $40.0B; +$21.4B (+114.7%); avg: +2.5%; They had 5 annual dips in $, including 2023. Sales dropped -4.9% in 2009 but -21.2% in 2020. They had a strong recovery, +34.1% in 2021. These were their only double-digit changes.

Clothing – $217.3B; +132.0B (+154.6%); avg: +3.1%; They only had 3 annual decreases, 2008, 2009 and the biggest, -29% in 2020. They had a huge recovery lift of +45.4% in 2021. Like Shoes, these were their only double-digit changes.

Jewelry, Luggage, Leather – $49.8B; +$33.7B (+208.9%); avg: +3.7%; They had the largest increase but also the most fluctuation – 7 decreases. The worst drop was -11.2% in 2009. They had a huge 53.6% lift in 2021 after -5.4% in 2020.

Sporting Goods, Hobby, Toy, Book, Music

This smallest, “entertainment” Subgroup lost -1.4% in share of Relevant Retl $, -40%. Within the Subgroup, Sporting Gds’ share jumped from 36.3% to 61.4%. The other 3 channels all had significant losses, with Books leading the pack, -11.3%.

Sporting Goods moved to the top in 2006 and stayed there. Toy/Hobby/Game essentially stabilized while Book and Sewing/Music/News began to decline. All had their biggest lift in 2021 then growth flattened or declined.

Relevant Retail: +301.7%     Sporting Goods, Toy, Hobby, Book, Music Subgroup: +137.6%

Book Stores – $9.7B; -$0.01B (-0.1%); avg: -0.002%; With the rise of the internet, sales have trended down since 2008. Their biggest drop, -30.0% was in 2020, followed by a +29.7% lift in 2021. They are 1 of only 2 negative channels.

Sewing, Music, News – $9.7B; +$1.9B (+24.3%); avg: +0.7%; This group also includes CD stores. Sales turned down in 2008, then stabilized until a -11.4% drop in 2020 which was followed by their biggest lift, +9.9% in 2021.

Toy, Hobby, Game – $21.4B; +$10.2B (+90.3%); avg: +2.1%; Sales were stable around $16B from 1998 to 2013, when they turned slightly up. $ fell 2017>19, grew 2020>22 then dropped in 23. Biggest changes: 2018, -7.3%; 2021, +26.4%.

Sporting Goods – $62.7B; +$47.1B (+302.2%); avg: +4.6%; Unlike the others, this channel is driven by physical activity. Its growth is strong, even exceeding Relevant Retail. Sales dropped in 2009, 2017>18 & 2022>23. The biggest drop was -4.5% in both 2017 & 2018. Their sales actually grew +16.6% in 2020, but they beat that with a +22.3% lift in 2021.

General Merchandise

This Subgroup lost 2.2% in its share of Relevant Retail $. Within the Subgroup, there were huge changes. While $/Value stores essentially held their place, -0.5%, Clubs/SuperCenters’ share skyrocketed from 16.1% to 73.1%. Department Stores – Traditional & Discount paid the price. Their combined share fell from 71.5% in 1992 to 15.0% in 2023.

You see 3 different patterns. 1. Strong Growth: Club/SupCtr; 2. Stability: $/Value; 3. Decline: Dept Stores

Relevant Retail: +301.7%     General Merchandise Subgroup: +256.7%

Traditional Department Stores – $29.9B; -$55.2B (-64.8%); avg: -3.3%; They have been fading for years with only 11 “up” years since 1992. Their biggest drop was -46.2% in 2020 but they “recovered” with a +46.6% lift in 2021.

Discount Department Stores – $102.7B; +10.8B (11.8%); avg; +0.4%; They are also fading, with only 4 “up” years since 2001. In fact, they are going away. Many are adding a big grocery section. They will be SupCtrs. The others, just Dept Strs.

$/Value Stores – $105.5B; +$74.7B (242.8%); avg: +4.1%; They evolved from 5&10¢ Stores. They have had steady, mid-level growth with no drops since 1998, but some stores are now struggling, especially with high cumulative inflation. Their biggest lift was +12.7% in 2020.

Warehouse Clubs/SuperCenters – $646.1B; +$606.0B (1514.1%); avg: +9.4%; They have become the dominant General Merchandise channel and their impact on the Relevant Retail Marketplace is second only to the Internet. They have had no down years. Their smallest lift was +0.9% in 2009. They had all double digit increases until 2006. Their biggest increase this century was +18.0% back in 2001.

Miscellaneous Stores

This small, mixed Subgroup lost only 0.9% share of Relevant Retail $. Within the group, A/O Miscellaneous (includes Pet) became dominant. Used Mdse also gained ground. The other 2 channels had double digit losses in share.
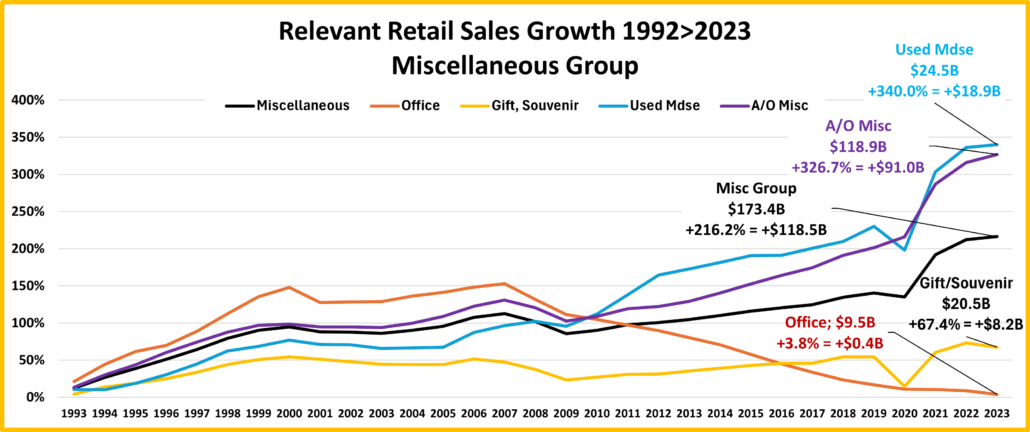
A mixture of channels & patterns – Growth, Stability, Decline. All had recession drops & sales for all, but A/O fell in 2020.

Relevant Retail: +301.7%     Miscellaneous Store Subgroup: +216.2%

Office – $9.5B; +0.4B (+3.8%); avg: +0.1%; They have been headed down since 2007, with a sales decrease every year. The biggest drop was -8.8% in 2009. Their biggest lift, +21.2% happened over 30 years ago in 1993.

Gift & Souvenir – $20.5B; +$8.2B (+67.4%); avg: +1.7%; For years their sales were steady around $17>18B. They had big drops in 2009 & 2020. They recovered strongly from COVID, +29.9% in 2021 and hit a new $ high, $21.2B in 2022.

A/O Miscellaneous – $118.9B; +$91.0B (+326.7%); avg: +4.8%; This mixed group has had strong, steady growth since an  -8.1% drop in 2009, including a +22.5% lift in 2021. Their growth exceeds Relevant Retail’s increase.

Used Merchandise – $24.5B; +$18.9B (+340.0%); avg: +4.9%; As consumers’ have become more focused on value, the appeal of this channel has increased. They had drops in 2009 & 2020 (-9.7%) but a huge, +35.4% lift in 2021.

NonStore

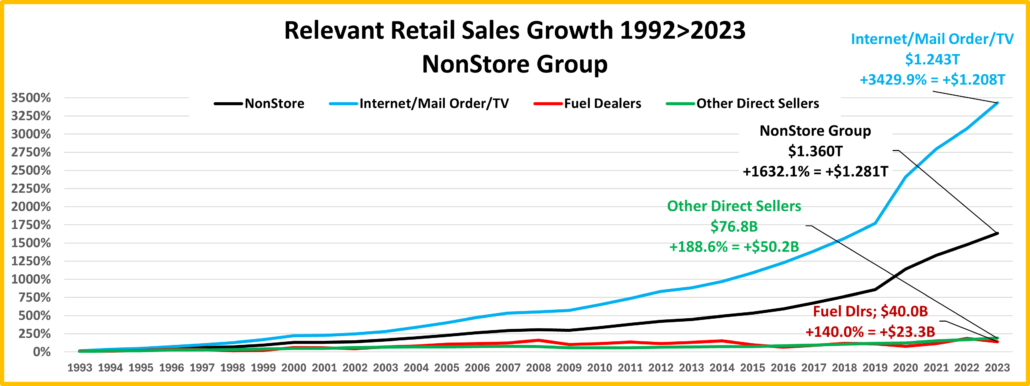
Thanks to the Internet, NonStore gained 21.1% in share and now have the biggest portion of Relevant Retail $, 27.4%. With 91.4% of the $, the Internet essentially owns the NonStore Subgroup.

Fuel & Other Direct more than doubled sales but that is nothing compared to the Internet, which sold 35 times more $.

Relevant Retail: +301.7%     NonStore Subgroup: +1632.1%

Fuel Dealers – $40.0B; +$23.3B (+140.0%); avg: +2.9%; This small channel had 16 double digit sales changes. The worst was -23.2% in 2009. The best was +34.0% in 2000. We should note that they were -15.6% in 23 after being +33.1% in 22.

Other Direct Sellers – $76.8B (+188.6%); avg: +3.5%; Their only down years were 2001 & 2008>10. The biggest drop was -9.2% in 2009. Their biggest lift was +12.3% in 2021. They had only 1 other double digit change, +10.8% back in 1994.

Internet/Mail/TV – $1.243T; +$1.208T (+3429.9%); avg: +12.2%; Since 1992 they have had no down years and 23 years with double digit growth. Best yr: +34.1% in 2020. With Selection, Value & Convenience, they are now America’s choice.

Now, it’s time to wrap our analysis up and lay out the results. The best way to compare channels is by Performance – divide a channel’s share of Relevant Retail’s growth by their 1992 share of $ales. Channels with a score of 100+% are earning their share. Here are the results for 29 channels.

There were only 2 Subgroups with 100+% Performance. There are 8 individual channels. Here are the 100+% Winners:

  • Internet/Mail 1137%
  • Clubs/SupCtrs 502%
  • NonDrug Health 167%
  • Drug Stores 122%
  • Used Mdse 113%
  • A/O Misc. 108%
  • Homecenters 103%
  • Sporting Goods 100%

If performance is 30% or less, the channel is likely in trouble. Here are the 8 Worst Performers:

  • Hobby,Toy,Game 30%
  • Electronics 25%
  • Gift/Souvenir 22%
  • Sewing/Music 8%
  • Disc Dept Strs 4%
  • Office 1%
  • Book -0.01%
  • Reg Dept Strs -21%

Many of the other 13 channels have problems but right now are getting by. In fact, if you take NonStore out of total $, the 4 with a score of 70>99% are “winning” their battle against other brick ‘n mortar retailers with 100+% performance.

Summary

Key Consumer Drivers – Value (Quality + Price), Convenience, Selection along with a big drop in the importance of Brand

Biggest Retail Market Changes:

  1. Consumers’ Movement to online shopping – mostly to NonStore but also in Brick ‘n Mortar Retailers
  2. Growth of Warehouse Clubs & SuperCenters, largely at the expense of Grocery & Department Stores
  3. The fall of Department Stores – Traditional & Discount
  4. The increasing demise of Big Box Specialty Retailers – especially Books, CD’s, DVD’s, Toy, Game, Electronics…