Retail Channel Monthly $ Update – September Final & October Advance

Time for our monthly update on U.S. retail sales by channel. The current COVID-19 crisis has caused turmoil in the Retail Marketplace. Consumer spending behavior has changed and continues to evolve. In this report we will track the changes and migration between channels. We will do that with data from two reports provided by the U.S. Census Bureau.

The Reports are the Monthly Retail Sales Report and the Advance Retail Sales Report. Both are derived from sales data gathered from retailers across the U.S. and are published monthly at the same time. The Advance Report has a smaller sample size so it can be published quickly – approximately 2 weeks after month end. The Monthly Final Report includes data from all respondents, so it takes longer to compile the data – about 6 weeks. Although the sample size for the Advance report is smaller, the results over the years have proven it to be statistically accurate with the final monthly reports. The biggest difference is that the full sample in the Final report allows us to “drill” a little deeper into the retail channels.

This means to get the full picture in our monthly channel update we need to look at the latest release of both reports. We will begin with the Final Retail Report from September and then move to the Advance Retail Report for October. This will also allow us to better track the consumers’ evolving spending behavior in terms of channel migration.

Both reports include the following:

  • Total Retail, Restaurants, Auto, Gas Stations and Relevant Retail (removing Restaurants, Auto and Gas)
  • Individual Channel Data – This will be more detailed in the “Final” reports and we fill focus on Pet Relevant Channels

The information will be presented in detailed charts to facilitate visual comparison between groups/channels of:

  • Current Month change – % & $ vs previous month
  • Current Month change – % & $ vs same month in 2019
  • Current YTD change – % & $ vs 2019
  • Monthly and Year To Date $ will also be shown for each group/channel

First, the September Final report. The retail market hit bottom in April then began a slow recovery. Sales $ peaked in July but are growing vs 2019. Here are the major retail groups. (The Data in all graphs is Actual, Not Seasonally Adjusted)

The final total is $2.8B more than the Advance report projected a month ago. Auto $ were the same as projected. Everyone else was up. Relevant Retail: +$2.5B; Restaurants:+$0.1B; Gas Stations:+$0.2B. $ales were still down from the  peak in all groups. However, driven by Relevant Retail, +$38B and Auto, +$14B, monthly sales were up $38B vs 2019.

An August > September decline in sales is normal. In 2019 the drop was -9%. In 2020 the drop was much smaller, only -3% , which is a good sign for a retail recovery. However, all groups but Relevant Retail are still down YTD vs 2019.

Now, let’s see how some Key Pet Relevant channels were doing in September.

  • Overall – $ in 7 of 11 groups were down vs August, but 10 of 11 were up vs September 2019 and 9 were up YTD.
  • Building Material Stores – This group has their biggest annual lift in Spring. This is unchanged and even stronger. While sales peaked in June, they’re still showing strong increases vs 2019. Although Sporting Goods stores are not included in this group, they have a similar Spring lift pattern. Their sales took off in May, peaked in June but continued to grow vs 2019. In June, their YTD $ vs 2019 turned positive and by September they were up 13.1%.
  • Food & Drug – $ fell in August & September but Supermarkets are maintaining incredibly strong growth vs 2019. Drug Stores $ bounced back after a decline in August and remain positive compared to 2019.
  • General Merchandise Stores – $ in Clubs/SuperCtrs stabilized in June and fell in September but are still strong vs 2019. Despite slowed sales in June>Sept, $ Stores are showing exceptional strength vs 2019. Discount Dept. store sales were generally slowing before the pandemic. This trend has continued despite a small Summer lift.
  • Office, Gift and Souvenir Stores – They were slow to re-open. $ grew but now are stable. They were hit hard.
  • Internet/Mail Order – The pandemic has accelerated this channel’s growth vs 2019. Sales peaked in August, but the crisis has introduced many new consumers to online shopping and the behavior is likely to become habitual.
  • A/O Miscellaneous – This is a group of small to midsized specialty retailers – chains and independents. It includes Florists, Art Stores and Pet Stores (22 to 24% of total $). Pet Stores were usually essential, but most stores were not. The others began reopening in May and the number grew in June which produced an increase vs 2019. Sales peaked in July but stabilized and remain strong vs 2019. In fact, YTD sales are up +10.2%.

The recovery began in May and continued in June and July as even more businesses began to re-open. The Relevant Retail Segment turned positive in all measurements in May and stayed that way through July. In August & September, sales fell but remained strong vs 2019. The key drivers in the positive numbers vs 2019 were the Internet, Supermarkets, SuperCtrs/Clubs/$ Stores and Hdwe/Farm.  How are things progressing? Here are the Advance numbers for October.

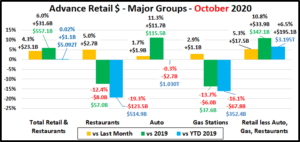
April and May were the 2 biggest spending drops in history. In June, monthly sales turned positive for the first time since February. The recovery continued in July but flattened out in Aug/Sept. In October, all groups spent more than in September. This lift turned YTD Total Retail positive for the 1st time since February.

Total Retail – Total Retail spending rose +$23.1B vs September and was up +6.0% vs October 2019. In February 2020 sales were up $60B, +6.6% YTD versus 2019. Then came COVID-19. Hopefully, we hit bottom at -$112B in May. We began moving in the right direction and finally broke even in October up $1.1B YTD but still down -$59B from February.

Restaurants – Spending increased +$2.7B from September but was still down -$8.0B vs October 2019. Things remain Topsy Turvy. August is usually their biggest $ month of the year. January and February, normally the 2 slowest months, are on top in 2020. In February YTD sales were up $9B. Then came the forced closures. Re-openings began in May but ran into problems in the Summer. Delivery/Pickup can’t make up the difference as spending is now down $123.5B YTD.

Automobile & Gas Stations – When you are staying home your car becomes less of a focus in your life. Auto Dealers began combating this attitude with fantastic deals and a lot of advertising. Monthly $ turned positive versus 2019 in June and have maintained this pace through October. The result is that this group is now only down -0.3% YTD vs 2019. Gas Station $ales increased in May>July over the previous month but fell in August & September. Sales turned up again in October but remain (-$67.8B YTD) People are still not driving as much, for commuting or road trips.

Relevant Retail – Less Auto, Gas and Restaurants – Many non-essential businesses shuttered their doors in March but there was also a rash of binge/panic buying for “necessities” and a big lift in groceries as consumers focused on home cooking which drove spending up $19B. April brought a full month of closures and an end in binge buying, spending dropped $34B from March. In May, the overall market began to reopen so spending began to move in the right direction. In June and July, the $ growth continued. $ fell in August & September but turned up again in October. We should note that the monthly June>October $ are larger than all months in 2019 but December. The primary drivers have been Nonstore, Grocery and SuperCenters/Clubs & $ Stores along with a big spring lift from the Hardware/Farm and Sporting Goods channels. The Relevant Retail group now has posted positive numbers versus last year and year to date for 6 consecutive months and is up $195.1B YTD (+6.5%) vs 2019. In May when the streak began, it was up +2.7%.

Now let’s look at what is happening in the individual retail channels across America. In October, consumer spending in the relevant retail market grew even more positive versus 2019. Let’s see where the $ came from. These groups are less defined than in the Final Monthly reports and we will look across the whole market, not just pet relevant outlets.

In September only 3 channels beat last months $. In October it was up to 11. In September, 10 channels beat September 2019. This number held in October. In YTD numbers, 8 are showing an increase – the same as September. The YTD decreases are coming from channels that are primarily nonessential businesses.

After a full month of stay at home and widespread closures there was a surge in May. Things truly opened up in June and July and sales continued to increase. In August and September, they slowed then grew again in October. Relevant Retail Channels are up $195.1B vs 2019. The essential channels are responsible for the YTD lift vs 2019, primarily:

  • Nonstore Retailers – Even more consumers are online shopping.
  • Food & Beverage, especially Grocery– Restaurant $ are still down so consumers continue to eat & drink at home.
  • Bldg Materials/Garden/Farm– A big Spring lift continues into the Summer/Fall as consumers focus on their home.
  • SuperCtrs/Club/Value/$ Strs – Sales slowed in April but came back in May and continue to grow vs 2019. This group turned the whole Gen Mdse channel positive. It clearly shows that value is still a consumer priority.

Regarding the Individual Large Channels

General Merchandise Stores – Regular Department stores are reopening which has cut the losses for total Department Stores as Discount Department stores continue to slowly fade. Club/SuperCtr/$ stores provided the big positive force. In April consumers dialed back their panic buying and spending on discretionary items was also down significantly. Since May we have seen consumer spending return to a more normal pattern in the big and small stores that promise value.

Food and Beverage, plus Health & Personal Care Stores – The Grocery segment is still driven by increased Food sales due to a slow restart by restaurants, up 10.3%, +$5.9B in October. Monthly Sales in the Health, Personal Care group have been up vs 2019 since June. Since August, the YTD $ have been positive. Drug Store $ growth was a key factor.

Clothing and Accessories; Electronic & Appliances; Home Furnishings – Except for September, monthly sales have grown every month since May. Home Furnishing was the only group with a decrease vs September, but they have had 5 consecutive monthly increases vs 2019. All 3 channels are down significant percentages in YTD sales. Clothing Stores are by far the worst performers. In October they were down 11.3% vs October 2019 and 30.0% YTD.

Building Material, Farm & Garden & Hardware – Sales peaked in the Spring. However, this channel continues to benefit from consumers turning their focus to their home needs, including house and yard repair and improvements. This has extended their Spring lift to Summer/Fall. $ were up 17.0% vs October 2019 and up +$42.9B (+13.2%) YTD.

Sporting Goods, Hobby and Book Stores – Book and Hobby stores are open and sales in Sporting Goods stores have taken off as Consumers again sought outdoor recreation. Although October sales fell again from their June peak, they were up 14.1% vs October 2019. YTD sales were down $3.4B in April. In September, this deficit was wiped out and through October YTD sales were +$1.8B (+2.8%).

All Miscellaneous Stores – This group is mostly small to medium specialty stores – both chains and independents. Pet Stores are essential but most other stores are not, so closures hit this group particularly hard. Sales began to rebound in May and grew through July when they finally beat the monthly sales for 2019. In Aug>Sept sales plateaued then turned up in October. Back In February, this group was up $2.6B YTD. Through July,  they were down -$3.2B but moving in the right direction. The lift in October has put them back on track, -$2.4B. However, they still have a long road ahead.

NonStore Retailers – 90% of the volume of this group comes from Internet/Mail Order/TV businesses. The COVID-19 crisis has only accelerated the ongoing movement to online retail. In February NonStore was up 8.6% YTD. In October they reached a new monthly sales peak for the year and they are up 21.9%, +$137.2B YTD. Their increase is 70% of the total $ increase for Relevant Retail Channels. They are the clear leader, and their performance far exceeds their 12.9% annual increase in 2019. Since much of their annual increase comes from holiday sales, 2020 could be another great year for NonStore Retailers.

Note: Almost without exception, online sales by brick ‘n mortar retailers are recorded along with their store sales in their regular channel. Whether they are up or down, their online sales are included in the totals.

Recap – April and May saw the 2 biggest year over year monthly sales declines in history. Restaurants, Auto and Gas Stations increased sales from May through July. By September, all had decreased sales but $ turned up again in October. The Auto segment is almost back to even in YTD vs 2019 but Restaurants and Gas Stations are still struggling. The Relevant Retail segment has been the only true positive. Sales turned up in October after slowing in Aug>Sep. Monthly and YTD sales vs 2019 are up for 6 consecutive months. However, for some segments in this group there is still a long way to go. Total Retail reached a new $ peak in October and edged past YTD 2019, +$1.1B (+0.02%). Now the virus is resurging, and retail restrictions may be reimposed in many areas. This is going to be a long battle with no end in sight.

We will continue to monitor the data and provide you with regular updates.


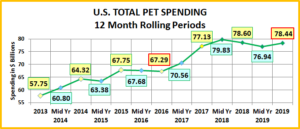
2019 U.S. TOTAL PET SPENDING $78.44B…Down ↓$0.16B

In 2019 Total Pet Spending in the U.S. was $78.44B, a $0.16B (0.2%) decrease from 2018. This decrease comes after 2 years of increases. As usual there were many factors behind the numbers, including some outside the control of the industry. Pet Food bounced back after the 2018 FDA warning regarding grain free dog food. However, the new tariffs on supplies had a huge negative impact on spending. Veterinary prices continued to rise. Spending was up slightly but the amount purchased by consumers actually fell. The Services segment $ declined slightly but essentially held its ground at the new high level established by record spending in 2018. Here are the $ changes:

  • A $2.35B (+8.1%) increase in Food
  • A $2.98B (-15.1%) decrease in Supplies
  • A $0.58B (+2.7%) increase in Veterinary
  • A $0.10B (-1.1%) decrease in Services

Let’s see how these numbers blend together at the household (CU) level. In any given week, 27.1 Million U.S. CU’s (1/5) spent money on their Pets – food, supplies, services, veterinary or any combination – down from 27.2M in 2018.

In 2019, the average U.S. CU (pet & non-pet) spent a total of $593.51 on their Pets. This was a small -0.8% decrease from the $598.41 spent in 2018. However, this doesn’t “add up” to a 0.2% decrease in Total Pet Spending. With additional data provided from the US BLS, here is what happened.

  • 0.6% more CU’s
  • Spent 0.1% more $
  • 0.9% less often

If 67% of U.S. CU’s are pet parents, then their annual CU Total Pet Spending was $885.84. Now, let’s look at the recent history of Total Pet Spending. The rolling chart below provides a good overview. (Note: All numbers in this report come from or are calculated by using data from the US BLS Consumer Expenditure Surveys – The 2016>2019 Totals include Veterinary Numbers from the Interview survey, rather than the Diary survey due to high variation)

  • We should note a 3 year pattern since 2010. 2 years of increases (yr 1 the largest) followed by a small decrease.
  • In 2014-15, the Food upgrade began, but early in 2015 consumers were trading $ in other segments to pay for it.
  • In 2016, they were intensely value shopping for super premium foods. They started spending some of this saved money on Supplies and Veterinary Services, but not quite enough as spending fell slightly for the year.
  • In 2017, spending took off in all but Services, especially in the 2nd half. Consumers found more $ for their Pets.
  • In 2018 a spectacular lift in Services overcame the FDA issue in Food, tariffs on Supplies and inflation in Veterinary.
  • In 2019 a bounce back in Food and small lift in Veterinary couldn’t overcome the drop in Supplies from “tarifflation”.

Now we’ll look at some Demographics. First, 2019 Total Pet Spending by Income Group

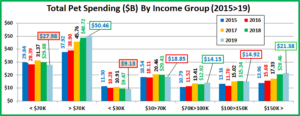
Spending was down under $70K but mixed in the higher income groups, with $100>150K down and the others up.

Nationally: · Total Pet: ↓$0.16B· Food: ↑$2.35B  · Supplies: ↓$2.98B  · Services: ↓$0.10B  · Veterinary: ↑$0.58B

  • < $70K(58.5% of U.S. CUs); CU Pet Spending: $364.24, -4.9%; Total $: $27.98B, ↓$1.90B (-6.4%) ..
    • Food ↓$0.63B
    • Supplies ↓$1.62B
    • Services ↓$0.26B
    • Veterinary ↑$0.60B

Money matters a lot to this group, especially to those on the low end. You can see the impact of inflation in Supplies and Services. The drop in Food spending is a late reaction to the FDA warning by Retirees ($30>39K). The big lift in Veterinary comes mosstly from the <$30K group who were catching up after a big decrease in 2018.

  • >$70K – (41.5% of U.S. CUs); CU Pet Spending: $913.12, -0.2%; Total $: $50.46B, $1.74B (+3.6%) from…
    • Food $2.97B
    • Supplies ↓$1.37B
    • Services ↑$0.16B
    • Veterinary ↓$0.03B
  • This group continues to grow, up 3.5% in 2019. This accounted for almost all of their spending increase. They also show that income remains the single biggest factor in Pet Spending. 41% of U.S. CUs spent 64% of Total Pet $. They led the recovery in Food but were still impacted by Supplies prices. Services $ were up but Vet $ were flat.
  • < $30K(27.0% of U.S. CUs); CU Pet Spending: $262.84, +1.4%; Total $: $9.13B, ↓$0.34B (-3.6%) from…
    • Food ↓$0.23B
    • Supplies ↓$0.63B
    • Services ↓$0.07B
    • Veterinary $0.58B

This lowest income group demonstrated their price sensitivity again in 2019. However, they are committed to their pets which is shown by their rebound in Vet Spending, +$0.58B, after a -$0.7B drop in 2018.

  • $30>$70K – (31.5% of CUs); CU Pet Spending: $448.48, -9.2%; Total $: $18.85B, ↓$1.56B (-7.6%) from…
    • Food ↓$0.40B
    • Supplies ↓$0.99B
    • Services ↓$0.19B
    • Veterinary $0.02B

This low to middle income group is also by necessity price sensitive. You see this in the drops in Supplies and Services. The drop in Food $ comes from Retirees’ ($30>39K) delayed reaction to the FDA warning. They did eke out a small, but second consecutive annual increase in Vet $. They are also committed to their pets.

  • $70>$99K – (14.5% of CUs); CU Pet Spending: $737.70, +10.0%; Tot $: $14.15B, $1.23B (+9.5%) from…
    • Food $0.62B
    • Supplies ↓$0.02B
    • Services ↑$0.15B
    • Veterinary $0.48B

This upper middle income group had a minimal negative reaction in Supplies and strong increases in all other segments. They were the best performing Pet Spending income group in 2019.

  • $100K>$149K– (13.8% of CUs); CU Pet Spend: $803.77, -8.1%; Tot $: $14.92B, ↓$0.42B (-2.7%) from…
    • Food $0.74B
    • Supplies ↓$0.67B
    • Services ↑ $0.10B
    • Veterinary ↓$0.59B

They were the Star of the income groups in 2015 and 2017. In 2016, they were the worst performers. 2018 saw increases in all segments but food. 2019 brought big increases in Food & Services while Vet & Supplies fell. Veterinary is a surprise. They have the money to fulfill their needs or wants, but are still very “value” conscious.

  • $150K> – (13.3% of CUs); CU Pet Spending: $1219.98, -1.5%; Total $: $21.38B, $0.93B (+4.5%) from…
    • Food $1.61B
    • Supplies ↓$0.67B
    • Services ↓$0.09B
    • Veterinary $0.08

Money Matters! They are the proof. They are the best performing income group in Total Pet Spending with 13.3% of U.S. Households generating 27.3% of all Pet $. They are also the only income group to increase annual Pet Spending every year since 2015. In fact they have furnished 69% of the Pet Industry’s $10.7B spending increase since 2015. This group is also growing. They added 0.8 million CUs in 2019, a 5.0% increase. In fact, their $0.93B increase was driven by the additional CUs. It does demonstrate that pet spending grows with consumers’ income, especially once you reach the $150K+ level.

Income Recap –  The top 2 drivers in consumer spending behavior are value (quality + price) and convenience. That makes income , especially disposable income very important in Pet Spending. Overall we see a big difference in pet spending behavior at the opposite ends of the income spectrum. The <$30K group has been trending down and is now below their 2015 $. On the other hand, the $150K+ group has increased Pet Spending every year since 2015. In 2019 the increase/decrease spending dividing line is basically $70K. This line is somewhat deceptive and not rigid. While the recovery in Food was only in the $70K+ groups, tarifflation drove Supplies spending down in all groups. <$70K also spent less on Services but so did the $150K+ group. Veterinary spending increased in every income level but $100>150K CUs. 2019 Total Pet Spending was definitely mixed when we look closer at the income groups.

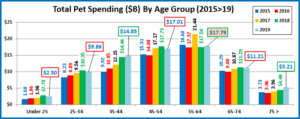
Next let’s look at 2019 Total Pet Spending by Age Group

Totally mixed results. The groups literally flipped up or down with every change in 10 year segment.

Nationally: · Total Pet: ↓$0.16B · Food: ↑$2.35B  · Supplies: ↓$2.98B  · Services: ↓$0.10B  · Veterinary: ↑$0.58B

  • <25 – (5.5% of U.S. CUs); CU Pet Spending: $336.22, -5.4%; Total $: $2.50B, ↓$0.29B (-10.5%) from…
    • Food ↓$0.36B
    • Supplies ↑$0.20B
    • Services ↓$0.13B
    • Veterinary $0.002B

This youngest group dialed back spending on Food & Services which produced their 1st Total Pet decrease in 5 yrs.

  • 25-34 – (16.1% of U.S. CUs); CU Pet Spending: $455.67, -6.8%; Total $: $9.86B, ↓$0.48B (-4.7%) from…
    • Food $0.10B
    • Supplies ↓$0.65B
    • Services ↓$0.04B
    • Veterinary $0.11B

These Millennials broke a 5 year pattern of increases. The drop was driven by Supplies. The other segments were relatively stable. Many are just starting households, so the fast rising Supplies’ prices were a big turnoff.

  • 35-44 – (16.9% of CUs); CU Pet Spending: $668.50, +1.3%; Total $: $14.85B, $0.39B (+2.7%) from…
    • Food $0.40B
    • Supplies ↓$0.82B
    • Services ↓$0.43B
    • Veterinary $1.23B

This group has the largest families and is in the middle of building their careers. This makes them very sensitive to value. You see this with the drops in the inflating, discretionary segments, Supplies & Services. However, they have a growing commitment to their pets which is evident from the big lifts in Food & Veterinary Spending.

  • 45-54 – (16.8% of U.S. CUs); CU Pet Spending: $761.74, -1.0%; Total $: $17.01B, ↓$0.71B (-4.0%) from…
    • Food $1.20B
    • Supplies ↓$0.75B
    • Services ↑$0.09B
    • Veterinary ↓$1.25B

This group has the highest income and occupies the top spot in CU Pet Spending. In 2018 they were briefly the leaders in Total Pet $ but they fell to #2 in 2019 because of a $2B decrease in Veterinary and Supplies spending. They are not “out of the running” yet. They had the biggest increase in Food $. We’ll see what 2020 brings.

  • 55-64 – (18.6% of U.S. CUs); CU Pet Spending: $723.79, +2.0%; Total $: $17.79B, $0.29B (+1.7%) from…
    • Food $0.81B
    • Supplies ↓$0.35B
    • Services ↑$0.07B
    • Veterinary ↓$0.23B

These younger Baby Boomers are especially reactive in Food trends, up or down. They are committed to their Pets but value is also an important factor. They reacted negatively to inflated prices in the Supplies and Veterinary segments but still appreciated the convenience of Services. The result was a small increase in Total Pet $.

  • 65-74 – (14.9% of U.S. CUs); CU Pet Spending: $572.02, -2.7%; Total $: $11.21B, ↓$0.08B (-0.7%) from…
    • Food $0.09B
    • Supplies ↓$0.50B
    • Services ↑$0.008B
    • Veterinary $0.33B

This group is growing, +2.1%. Many are retired and now 90% are Baby Boomers. They are careful with their money, but their commitment to their pets is very apparent as 1.04% of their total spending is on their companion animals. Their strong reaction to Supplies Price Inflation overcame small increases in every other segment.

  • 75> – (11.2% of U.S. CUs); CU Pet Spending: $364.25, +9.5%; Total $: $5.21B, $0.73B (+16.3%) from…
    • Food $0.11B
    • Supplies ↓$0.11B
    • Services $0.34B
    • Veterinary ↑$0.39B

Pet Parenting is more difficult, and money is tight for these oldest Pet Parents, but their commitment is still there. They were negatively impacted by Supplies price increases but increased their spending in the other segments. The lift was especially strong in both Service segments and pushed them to the biggest increase in Total Pet $.

Age Group Recap: There was an age spending pattern, but it was unusual. Over age 25, spending flipped up or down with every change in 10 year age group. This produced an unusual winner, 75+ year olds and an unusual loser, the high income, 45>54 year olds. There were some patterns within segments. Everyone over 25 spent more on Food and less on Supplies. The drop in Services came from those under 45. Veterinary Spending increased in all age groups except the 45>64 year olds.

Next, we’ll look at the biggest winner and loser in each demographic category. In some cases, a clear spending pattern is evident. In those situations, segments are bundled together to reflect their shared spending behavior.

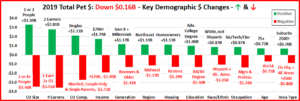
Key Demographic “Movers” for 2019.

In 2019, 50 of 96 Demographic Segments (52%) spent more on their Pets. Usually, this would produce an increase, but the size of the drops outweighed the increases, so spending fell -$0.16B (-0.2%). Let’s look at some specifics:

CU Size – 2+ are the “usual” winners but not in 2019. Singles and 3 person CU’s produced the only positives.

# of Earners – More earners usually means more income and increased pet spending. That was partially true in 2019 as 2 earners led the way. However, the results were mixed in other CUs with 1 earner, 2+ CUs finishing on the bottom.

CU Composition – An unusual result – with Singles the clear winner. They tend to be in the younger or older age groups. Married, with children CUs had mixed results. The big surprise was Married Couples only CUs, normally strong performers, were at the bottom along with Single Parents who are no strangers to the bottom of the spending ladder.

Income – While the $100>149K group spent less, the major income dividing line in Pet Spending was over/under $70K.

Generations – The results were split among age groups within generations. The older Millennials and younger Gen Xers spent more as did younger Boomers and those  born before 1940. This couldn’t quite make up for the drop in spending by the older Boomers and the younger Silent Generation. Generational spending reflects the mixed bag in Total Pet $ in 2019. However, Boomers’ pet spending was down for the second consecutive year.

Region – The Northeast spent more. All other regions spent less. Although the only significant drop was in the Midwest.

Housing – Another clear divide – Homeowners $; Renters ↓$

Education – Another reflection of turmoil – Adv Degree $; BA/BS ↓$. Note: Less than College Grads were up $0.14B.

Racial/Ethnic – A clear racial/ethnic divide – White, not Hispanic were up +1.3%. African Americans and Hispanics combined were down -11.4%, with 65% of the decrease coming from African Americans. Note: Asians were +1.6%.

Occupation – A reversal of expectations – Lower level white collar employees spent more while their bosses spent less.

Age– As noted: Age groups had no clear pattern. 45>54 yr old Gen Xers were down while the oldest group spent more.

Area – Another simple divide: Suburbs over 2500 population, which account for 45% of CUs and 46% of Total Pet $ spent more. All other areas – Center City, Small Suburbs and Rural spent less.

Finally: Pet Spending turned slightly down in 2019. The driver was the truly widespread drop in Supplies Spending as we saw the full impact of added tariffs hit home. There was some good news as Food began recovery from the 2018 FDA grain free warning and Veterinary again posted a small increase. Also, while Services spending was down slightly, the segment held its ground at its new elevated level. 2019 Pet Spending was a truly mixed bag with few clear trends.


2019 U.S. VETERINARY SERVICES SPENDING $21.80B…UP ↑$0.58B

Veterinary Services is the 2nd largest segment in the Pet Industry. High inflation, 3.5+%, caused a reduction in Veterinary visits from 2014>2016. In 2017 inflation slowed markedly (+2.2%) and consumers responded. In 2018 prices turned upward (+2.6%) and spending plateaued. In 2019 inflation was up +4.1% and Veterinary Spending reached $21.80B – Up $0.58B (+2.7%) from 2018. However, considering inflation, “real” spending was actually down -1.4%. In this report, we’ll take a closer look at the demographics behind the 2019 numbers. (Note: All 2019 numbers in this report come from or are calculated by using data from the US BLS Consumer Expenditure Interview Survey, rather than their Diary report. The low frequency of Veterinary Visits is still generating an exceptionally high variation on the data collected by the Diary method. Interview seems to be a more logical and accurate way to track Veterinary Service Expenditures.)

Let’s get started. Veterinary Spending per CU in 2019 was $164.88, up slightly from $161.51 in 2018. (Note: A 2019 Pet CU (67%) Spent $246.09) More specifically, the increase in Veterinary spending came as a result of:

  • 0.6% more CU’s
  • Spending 0.5% less $
  • …2.6% more often

We’ll take a closer look. But first, the chart below gives an overview of recent Veterinary Spending.

The big spending drop in the first half of 2015 coincided with the upgrade to Super Premium Foods – Trading $. Then consumers began value shopping for Premium Foods. The subsequent savings freed up $ for Veterinary Services. Spending began to climb until it flattened out at the beginning of 2017. In 2017, Veterinary inflation slowed markedly in the second half. The result was that spending literally “took off”. In 2018 prices turned up again. Consumers responded by essentially “holding their ground” through 2019. There is some price sensitivity in Veterinary Services Spending.

Now, let’s look at Veterinary spending by some specific demographics. First, here is a chart by Income Group

Although not as pronounced as Pet Services, Veterinary Spending is driven by income, 2019 was “mixed”. The only decrease came from the $100>150K income group and the biggest lifts were from <$30K & $70>100K.

National: $164.88 per CU (+2.1%) – $21.8B – Up $0.58B (+2.7%)

  • Over $150K (13.3% of CUs) – $365.23/CU (-3.6%) $6.40B, Up $0.08B (+1.3%) This highest income group is the biggest driver in Veterinary Spending as 13.3% of CUs generated 29% of 2019 $. Their $ were basically flat in 2019.
  • $100>150K (13.8% of CUs) – $214.43/CU (-17.8%) $3.91B, Down $0.59B (-13.1%) This middle/upper income group reacted strongly to the slowed inflation rate in 2017 but as prices turned up, their spending slowed then fell in 2019.
  • $70K>100K (14.5% of CUs) – $217.10/CU (+12.9%) $4.15B, Up $0.48B (+13.1%) Their spending has steadily grown since 2016. In 2019, they had the 2nd biggest increase overall and largest of any over $70K group.
  • $30K>70K (31.5% of CUs) – $119.35/CU (-1.8%) $4.97B, Up $0.02B (+0.5%) This is the 2nd largest group in Veterinary $ and their spending pattern is remarkably similar to the big spending $150K+ group. Vet $ were flat in 2019.
  • Under $30K (27.0% of CUs) $66.43/CU (+39.8%) $2.37B, Up $0.58B (+32.3%) This group is very price sensitive. After an increase in all segments in 2017, they dialed back their pet spending on Food and Veterinary Services in 2018. They recovered 75% of the Veterinary drop in 2019 but are still 25% below their Veterinary Spending in 2015.

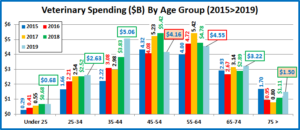
Now, here is Veterinary Spending by Age Group

The drop came from 45>64 yr olds while the younger and older groups spent more.

National: $164.88 per CU (+2.1%) – $21.8B – Up $0.58B (+2.7%)

  • <25 (5.5% of CUs) – $92.98/CU (+3.8%) – $0.68B – Up $0.002B (+0.3%) This youngest group is getting serious about the responsibilities of Pet Parenting. While spending was flat in 2019, It is up +134% since 2015. 3.4% fewer CUs spent 9.9% more $ 5.5% less often.
  • 25>34 (16.1% of CUs) – $123.75/CU (+4.6%) – $2.63B – Up $0.11B (+4.2%) The commitment of these Millennials to their pets is growing. Their Veterinary $ ticked up in 2019 after being stable for 2 years. 0.3% fewer CUs spent 0.2% less $ …but 4.8% more often.
  • 35>44 (16.9% of CUs) – $226.62/CU (+30.2%) – $5.06B – Up $1.23B (+32.2%) In 2018, these mostly Gen Xers significantly ramped up their spending on Veterinary Services. This commitment accelerated in 2019 as they moved to the top in Veterinary spending. 1.5% more CUs spent 25.9% more $ …3.4% more often
  • 45>54 (16.8% of CUs) – $186.75/CU (-20.5%) – $4.16B – Down $1.25B (-23.2%) This group has the highest income, but value is still a big driver. In 2017, the radically slowed inflation caused them to spend significantly more money and more often. In 2018, prices turned up and continued to inflate in 2019. They hit a wall as spending dropped precipitously and they fell from the top spot in Veterinary $ and even below their 2015 numbers. 3.3% fewer CUs spent 19.1% less $…1.8% less often
  • 55>64 (18.6% of CUs) – $185.24/CU (-5.2%) – $4.55B – Down -$0.23B (-4.8%) This group is all Baby Boomers and was the leader in Veterinary Spending prior to 2015. In 2015 they upgraded to Super Premium Food and Vet Spending fell. In 2016 they began to spend more again on Veterinary Services. In 2017, as inflation significantly slowed, they regained the top spot… but not for long. In 2018 Veterinary prices began to strongly inflate again. Their spending fell and continued the downward spiral into 2019. 0.3% more CUs spent 4.2% less $…1.0% less often
  • 65>74 (14.9% of CUs) – $163.32/CU (+9.1%) – $3.22B – Up $0.33B (+11.3%) This group is growing in numbers and very price sensitive. 90% are Boomers so they are committed to their pets. Despite rising prices, they significantly increased the frequency of purchase and their spending grew. 2.1% more CUs spent 3.0% less $…12.4% more often
  • 75> (11.2% of CUs) – $101.63/CU (+25.3%) – $1.50B – Up $0.39B (+35.2%) This group of oldest Pet Parents has a strong commitment to their pets – in 2015 a $1B increase in Veterinary Spending. In 2016, they upgraded their food. In 2017 they increased spending in Food, Supplies and Services. In 2018, they turned their attention back to Veterinary and in 2019 they had increases in all but Supplies. 7.9% more CUs spent 14.9% more $…9.1% more often

Now, let’s take a look at some other key demographic “movers” behind the 2019 Veterinary Spending numbers.

Veterinary spending increased by $0.58B (+2.7%) in 2019. However, considering the 4.1% inflation rate, the amount of Veterinary Services was actually down 1.4% for the year. 2019 was a “mixed positive bag”. 56 of 96 demographic segments (57.3%) spent more on Veterinary Services while 40 segments spent less. There was less turmoil than in the other segments as only 4 flipped from first to last or vice versa while 7 segments maintained their position from 2018.

There were also some of the “usual” winners and losers. On the winning side were Homeowners with mortgages, White, Not Hispanic CUs, Advance College Degrees, 2 Earners and Suburban Areas over 2500 Population.

The “usual” losers were fewer in number and included: Single Parents, African Americans and Homeowners w/o Mtges.

That means that there were also some Surprises:

  • Winners: Singles, 1 Person, 35>44 yr olds, Millennials/Gen Z, <$30K, Tech/Sls Clerical Workers
  • Losers: 2 People, Suburban <2500, 45>54 yr olds, Mgrs & Professionals, $100>149K, Boomers.

In our earlier analysis we saw evidence in spending increases by income and by age groups. This data reinforces those results. Although the lift was relatively widespread by income, the bulk of the lift was coming from lower incomes.

  • Singles/1 Person
  • Tech/Sls/Clerical
  • Millennials/Gen Z
  • Under $30K

These winners reflect the strength of lower income groups in Veterinary Spending in 2019.

The trend in age groups was a drop in the 45>64 yr olds, with a lift in the older and especially the younger groups. These winning groups tend to be younger. Those marked with an * tend to be either younger or older.

  • * Single/1 Person
  • 35>44 yr Olds
  • 2 Earners
  • Millennials/Gen Z
  • Tech/Sls/Clerical
  • * Under $30K

You can see that the Age spending trend is clearly reflected in the details.

One of the biggest trends of note is the ongoing decline in Baby Boomer Veterinary Spending. This group, which fueled the growth of the Pet Industry has now had the biggest decline in Veterinary Spending for 2 consecutive years.

The Younger groups are definitely stepping up in Pet Spending. The 35>44 yr olds took over the top spot in Veterinary spending in 2019. However, it is even more important to note that the groups born after 1964 – Gen X/Millennial/Gen Z have increased their Veterinary Spending by over $3B since 2017. The Boomers are the biggest Pet Spenders because of their numbers and will be a force in the industry for years to come, but the “torch” is slowly but surely being passed.


2019 U.S. PET SERVICES SPENDING $8.62B…Down ↓$0.10B

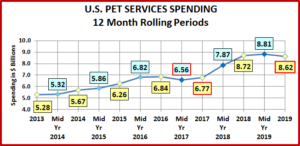
Except for a small decline in 2017, Non-Vet Pet Services has shown consistent growth in recent years. In 2018, that changed as spending grew a spectacular $1.95B to $8.72B. The number of outlets offering Pet Services has grown rapidly and consumers have opted for the convenience. However, prices were also strongly increasing. In the 2nd half of 2019 spending turned down. The final 2019 $ were $8.62B, down $0.1B (-1.1%). In this report we will drill down into the data to see what groups caused this slight decline . (Note: All numbers in this report come from or are calculated by using data from the US BLS Consumer Expenditure Surveys)

Services’ Spending per CU in 2019 was $65.22, down from $66.36 in 2018. (Note: A 2019 Pet CU (67%) Spent $97.34)

More specifically, the 1.1% decrease in Total Pet Services spending came as a result of:

  • 0.6% more households
  • Spending 2.39% less $
  • 0.69% more often

The chart below gives a visual overview of recent spending on Pet Services

You can see that after the big lift in 2018, spending essentially flattened out in 2019, similar to the pattern for the 18 months from mid-2016 through 2017. The increased availability and convenience of Services has radically driven up the spending on Services. This happened despite a return to a more normal inflation rate, +2.4%, as more people opted to use Pet Services and to do it more often. However, inflation grew even stronger, +2.5%. By the 2nd half of 2019, it made an impact as spending declined for the 1st time in 18 months. Now, let’s look at some specific spending demographics.

First, by Income Group.

In 2018, all income groups increased spending. In 2019 the middle income group, $70>150K, spent more but the lower, <$70K, and upper, $150K+ spent less. Most of the decrease (74%) came from the <$70K group and spending by the <$30K group actually fell below the level in 2015.

  • <30K (28.7% of CU’s) – $19.68 per CU (-3.7%) – $0.70B, Down $0.07B (-8.9%)This segment is getting smaller and money is tight, so Services spending is less of an option. In 2019 their Services $ fell to 9% below 2015.
  • $30>70K (31.0% of CU’s) – $34.90 per CU (-13.5%) – $1.45B, Down $0.19B (-11.4%)This group had the biggest decrease in Total Pet spending and Services $. Like the Supplies segment, their spending pattern mirrors $150K+.
  • $70>100K (14.5% of CU’s) – $65.00 per CU (+13.5%) – $1.24B, Up $0.15B (+13.8%) – Their spending has slowly but consistently grown since 2016. They had the biggest $ increase in Services and Total Pet. Note: They were the only group with an increase in spending per CU.
  • $100>150K (13.8% of CU’s) – $108.40 per CU (-0.2%) – $1.98B, Up $0.10B (+5.5%) – They have shown the strongest, most consistent growth since 2016. Total Pet spending was down but Services and Pet Food spending were up.
  • $150K> (13.3% of CU’s) – $185.43 per CU (-7.5%) – $3.25B, Down $0.09B (-2.8%)They have a couple of minor spending dips, including 2019. However, this is who spends the big bucks on Services – up over $1B since 2015.

Now, let’s look at spending by Age Group.

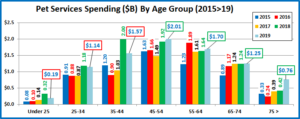
All age groups spent more on Services in 2018. In 2019 there was a clear dividing line. The groups under 45 spent less on Services (Big loser: 35>44, -$0.43B) while those 45 or older spent more. (Big winner: 75+, +$34B) Here are the specifics:

  • 75> (11.2% of CU’s) – $51.36 per CU (+67.4%) – $0.76B – Up $0.34B (+80.5%) This rapidly growing group has the greatest need for pet services, but money is always an issue. In 2019 their income grew 8.1% and they spent a lot of this extra money on more Pet Services. 7.9% more CU’s spent 57.9% more $, 6.0% more often.
  • 65>74 (14.9% of CU’s) – $63.45 per CU (-1.4%) – $1.25B – Up $0.01B (+0.7%). This group is also very value conscious. They are also growing in numbers. In 2019 it looks like they value shopped and found some deals, so they eked out a small gain. 2.1% more CU’s spent 4.3% less $, 3.0% more often.
  • 55>64 (18.6% of CU’s) $69.38 per CU (+3.6%) – $1.70B – Up $0.07B (+4.0%) After a big drop in 2017, they began to slowly increase Services spending. In 2019, frequency fell, but they moved up to the #2 spot in Services spending, due in large part to the big decrease by the 35>44 yr olds. 0.3% more CU’s spent 9.5% more $, 5.4% less often.
  • 45>54 (16.8% of CU’s)- $90.23 per CU (+8.4%) – $2.01B – Up $0.09B (+4.8%) This highest income group was the leader in Services $ until 2016. They spent a lot more in 2018 and the growth continued in 2019 due to a big increase in frequency. The result: They are back to #1 in Services $. 3.3% fewer CU’s spent 4.3% less $, 13.3% more often.
  • 35>44 (16.9% of CU’s) – $70.09 per CU (-22.8%) – $1.57B – Down $0.43B (-21.7%) Spending exploded in 2018 with a $1B increase. In 2019 they spent $1.6B more on Veterinary and Food. They got some of those $ by cutting back on the more discretionary segments, Services and Supplies. 1.5% more CU’s spent 19.4% less $, 4.3% less often.
  • 25>34 (16.1% of CU’s) – $53.87 per CU (-3.0%) – $1.14B – Down $0.04B (-3.3%) This group of Millennials “found” the Services segment in 2018 with a 36% spending increase. In 2019, like their 35>44 yr old brethren, they also dialed back their discretionary spending on Services and Supplies. 0.3% less CU’s spent 3.5% more $, 6.3% less often.
  • <25 (5.5% of CU’s) – $26.04 per CU (-38.3%) – $0.19B – Down $0.13B – (-40.4%) After the big lift in 2018 this small, youngest group returned to being a very minor player. 3.4% fewer CU’s spent 40.6% less $, 3.9% more often.

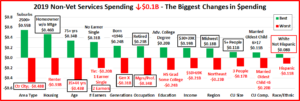
Finally, here are some other key demographic “movers” that helped to plateau Pet Services Spending in 2019. The segments that are outlined in black “flipped” from 1st to last or vice versa from 2018. The red outline stayed the same.

In 2018 the Services spending increase was very widespread with (88%) of all segments spending more. 6 of 12 demographic categories had no segments that spent less on Services in 2018. 2019 was very different and reflected the slight decrease in spending for the segment. All categories had segments that spent less on Services and 49 total segments (51%) had decreased Services $ from 2018.

There was other evidence of the spending balance which resulted in the plateauing of Services spending. 5 segments flipped from 1st to last and 5 segments flipped from last to first. Only 1 group maintained their position – White, not Hispanics had the biggest increase in the racial/ethnic category.

There were only 2 other “usual” winners – Suburbs 2500> and those with Advanced College Degrees. In terms of “usual” losers, Renters and Hispanics are often at the bottom of Pet Spending ladders.

In our earlier analysis, we saw a very distinct pattern in the spending by age group. Americans 45 and over, led by the 75+ group, spent more on Services. Those under 45, driven down by the 35>44 year olds, spent less. Let’s see how those two patterns are reflected in the chart above.

First, the lift by the older group is evident from these winners:

  • Homeowners w/o Mtge
  • 75+ yrs old
  • No earner, Single
  • Born before 1946
  • Retirees
  • $30>39K (avg income of Retirees)

That’s half of the twelve winners. Now, the decrease by the younger group in these losers:

  • 35>44 yrs old
  • Gen X
  • Married, Oldest Child <6
  • 2 Earners (usually younger CUs)
  • Renters (most likely <45 yrs)
  • $50>69K (avg income of <35 yrs)

The pattern for the younger groups is also reinforced by the details.

There is 1 winner that seems to be out of place, the 5+ CU. Shouldn’t that be a younger CU, with kids? It turns out the largest CUs are Other Married Couples – Extra Adults, no kids. Their average age is 51 and they spent more on Services.

Once again, we are reminded that you must drill below the surface to find the true story.

After the huge lift in spending in 2018, Services spending plateaued in 2019. There were a lot of ups and downs, but overall the segment remained essentially stable at its new elevated level of spending. The young group will undoubtedly come back as their pet spending tends to be more volatile in each segment. It is very encouraging to see the increased spending by the fast growing older segment. This bodes well for the future.

COVID-19 presents the greatest uncertainty for 2020. The pandemic with widespread closures and “staying at home” likely had a big impact on this predominantly “nonessential” Pet Industry segment. We’ll get the first indication in the mid-year report published in May 2021.