Retail Channel Monthly $ Update – April Final & May Advance

Time for our monthly update on U.S. retail sales by channel. The current COVID-19 crisis has caused turmoil in the Retail Marketplace. Consumer spending behavior has changed and continues to evolve. In this report we will track the changes and migration between channels. We will do that with data from two reports provided by the U.S. Census Bureau.

The Reports are the Monthly Retail Sales Report and the Advance Retail Sales Report. Both are derived from sales data gathered from retailers across the U.S. and are published monthly at the same time. The Advance Report has a smaller sample size so it can be published quickly – approximately 2 weeks after month end. The Monthly Final Report includes data from all respondents, so it takes longer to compile the data – about 6 weeks. Although the sample size for the Advance report is smaller, the results over the years have proven it to be statistically accurate with the final monthly reports. The biggest difference is that the full sample in the Final report allows us to “drill” a little deeper into the retail channels.

This means to get the full picture in our monthly channel update we need to look at the latest release of both reports. We will begin with the Final Retail Report from April and then move to the Advance Retail Report for May. This will also allow us to better track the consumers’ evolving spending behavior in terms of channel migration.

Both reports include the following:

  • Total Retail, Restaurants, Auto, Gas Stations and Relevant Retail (removing Restaurants, Auto and Gas)
  • Individual Channel Data – This will be more detailed in the “Final” reports and we fill focus on Pet Relevant Channels

The information will be presented in detailed charts to facilitate visual comparison between groups/channels of:

  • Current Month change – % & $ vs previous month
  • Current Month change – % & $ vs same month in 2019
  • Current YTD change – % & $ vs 2019
  • Monthly and Year To Date $ will also be shown for each group/channel

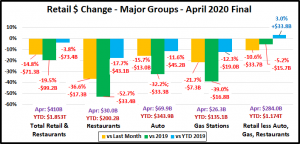
We’ll start with the April Final report. This was the depth of the crisis (hopefully). The impact is very visible. First, we will look at some major retail groups. (Note: The Data in all graphs is Actual, Not Seasonally Adjusted)

It is slightly better ($8B) than the Advance report projected a month ago. Although Restaurant $ales were $2B less than expected, the “Relevant Retail” segment was $10B better. Gas Stations also were $1B more than the early numbers but The Auto Segment was “spot on”. However, It was still by far the worst year over year monthly performance in history.

In a “normal” April we are generally into the Spring Lift as consumers begin to turn to outside activities. However, the widespread closures and “stay at home” guidelines generally ended that behavior.

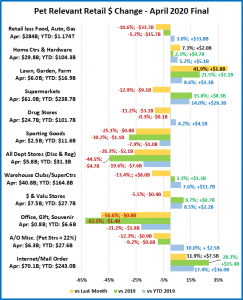
Now, let’s see how some Key Pet Relevant channels were doing in April.

  • Overall – Any binge spending ended in April as only Internet and Hardware/Farm had a March to April increase.
  • Building Material Stores – This group typically has their biggest annual lift in Spring. It appears that this is unchanged. Farm Stores did especially well with spectacular increases in all measurements. Although Sporting Goods stores are not included in this group, they have a similar Spring lift pattern. However, the results are totally different. You truly see the impact of the sports/recreation “shut down”.
  • Food & Drug – Although the March binge buying is over, Supermarket sales continue with strong growth. Drug Stores also had a March sales rush on essentials, but that clearly ended in April as sales are below April of 2019.
  • General Merchandise Stores – Although the March binge buying is over, sales in $ Stores, Clubs/SuperCtrs are both up, with $ Stores showing the most growth. Most traditional Department stores were closed and shopping in many Discount Department stores was often limited to essentials. The result is that sales were down -44.5% vs April 2019.
  • Office, Gift and Souvenir Stores – Most of these stores are deemed non-essential. You see the result.
  • Internet/Mail Order – “Stay at home” has further accelerated this channel’s growth. This will likely continue as the crisis has introduced many new consumers to online shopping.
  • A/O Miscellaneous – This is a group of small to midsized specialty retailers – chains and independents. It includes Florists, Art Stores and Pet Stores. Pet Stores generally account for 22 to 24% of this group’s total sales. Although Pet Stores were generally deemed essential most stores were not. The group was up 21% YTD in February which is the only reason that they are still “hanging on” to a YTD increase.

April was certainly a terrible month for retail spending, the biggest Total Retail $ drop in history. The March binge/panic buying ended in April and we saw the huge negative impact of a full month of non-essential business closures. In May, a very slow reopening of the economy began. Let’s see how it is progressing. Here are the Advance numbers for May.

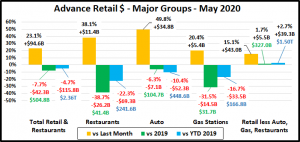
April was the biggest spending drop in history. May was $95B better but still $42B (-7.7%) below May of 2019. That  gives us an idea of how serious the current situation is and how long the recovery may take.

Total Retail – Total Retail spending fell $42B, -7.7% vs 2019, edging out March for the 2nd biggest drop in history. Remember, 2020 started off strong. Spending through February was up $60B, +6.6% versus 2019. Then came the COVID-19 crisis and now it is down -$116B – a $176B turnaround in just 3 months.

Restaurants – Spending increased $11B over April but was still down $26B vs 2019. The year started out good, up $9B (+8.1%) through February. Then social distancing began, and many restaurants closed. Delivery and curbside pickup couldn’t make up the difference as spending fell $78B in 3 months so this group is now down $69B YTD.

Automobile & Gas Stations – If you can’t go out, except for necessities, then your car becomes less of a focus in your life. Buying a car was definitely less of a priority. Auto Dealers, both new and used, tried to combat this with some fantastic deals and a lot of advertising. It appears to be helping but sales were still down $7B versus 2019. In terms of Gas Stations, May is traditionally the beginning of the vacation travel season but not in 2020. Prices are still down but people are still not driving as much as they used to, whether for commuting or road trips.

Relevant Retail – Less Auto, Gas and Restaurants – Many non-essential businesses began to shutter their doors in March but there was also a rash of binge/panic buying for “necessities” and a big lift in groceries as consumers focused on home cooking which drove spending up $19B. Then came April. With a full month of closures and an end in binge buying, spending dropped $34B, -10.7% from March and 16B, -5.2% vs April 2019. In May, the overall market began a slow reopening so spending began to move in the right direction. Nonstore and Grocery, along with SuperCenters/Clubs & $ Stores continued their growth. The spring lift in the Hardware/Farm channel got even stronger and the group which includes Sporting Goods, Hobby & Book Stores bounced back to beat their May 2019 numbers. The Relevant Retail group now has positive numbers in all measurements – vs last month, last year and year to date.

Now let’s look at what is happening in the individual retail channels across America. In May, consumer spending in the relevant retail market returned to positive numbers. Let’s see where the $ came from. These groups are less defined than in the Final Monthly reports and we will look across the whole market, not just pet relevant outlets.

Every group had a May sales increase over April, but performance was mixed when it came to vs 2019 and YTD. 

Observations

April was a full month of stay at home, widespread closures and reduced discretionary spending so it was an easy number to beat. However, only 7 of 13 groups had positive numbers for May 2020 vs 2019:

  • Nonstore Retailers – Even more consumers are online shopping.
  • Food & Beverage, especially Grocery– Restaurant $ are still down so consumers continue to eat & drink at home.
  • Sporting Gds/Hobby/Books – Stores reopened and consumers started to return to outside recreational activities.
  • Bldg Materials/Garden/Farm – A big Spring lift as consumers focus “on their home” even more than usual.
  • SuperCtrs/Club/Value/$ Strs – Sales slowed in April, but they came back strong in May and it was enough to turn the whole Gen Mdse channel positive. This group of stores offers great value which is still a consumer priority.

Regarding the Individual Large Channels

General Merchandise Stores – Some Regular Department stores began reopening and Discount Department stores held their ground, so this cut the losses for Department Stores. Club/SuperCtr/$ stores provided the big positive force. In April consumers dialed back their panic buying and spending on discretionary items was also down significantly. In May we saw consumer spending return to a more normal pattern in the big and small stores that promise value shopping.

Food and Beverage, plus Health & Personal Care Stores – The Grocery segment is still being driven by increased Food sales due to restaurant closures, up 14.3%, +$8B. Sales in the Health, Personal Care group are up minimally from April but remain down overall. Many Personal Care stores are slow to reopen and Drug Stores sales are essentially flat.

Clothing and Accessories; Electronic & Appliances; Home Furnishings – As stores reopen there was a spectacular increase in sales over April. However, May $ were still down big time from 2019. They all had the same pattern, with Clothing Stores being the most extreme. Their sales were up 209% from April but still down 63% vs 2019 and 43% YTD. These channels have a long way to go to recover.

Building Material, Farm & Garden & Hardware – This channel has its biggest spending lift in the Spring. The shelter in place rules caused many consumers to turn their focus to their needs at home, including house and yard repair and improvement. This has further accelerated the usual Spring lift. Sales are up across the board, including +6.7% YTD.

Sporting Goods, Hobby and Book Stores – Book and Hobby stores which had been closed started to reopen. Sporting Goods stores had generally been open but organized sports were on hold, parks closed, and non-essential travel was discouraged. In May things began to open up and consumers once again sought outdoor recreation. Sales literally doubled from April. The May Sales even beat 2019 by 6%. However, YTD they were still down 10%.

All Miscellaneous Stores – This group is mostly small to medium specialty stores – both chains and independents. While Pet Stores are essential, most other stores in this group are not. The closures hit this group particularly hard. May sales were up 27.3% from April as the reopening began but they are still down 24.3% vs May of 2019. In February they were up $2.6B, +14.3% YTD. In 3 months, this changed to down -$4.3B, -8.3%. That’s quite a negative turnaround.

NonStore Retailers – 90% of the volume of this group comes from Internet/Mail Order/TV businesses. The COVID-19 crisis has only accelerated the ongoing movement to online retail. Compared to 2019, NonStore was up 16.3% in March, 22.5% in April and 25.3% in May. Since April they have been the leader in all sales measurements regardless if it is in $ or % increase. Also, their YTD sales are up 16.6%, exceeding their 12.9% annual increase in 2019. This early year lift bodes well for 2020 as much of their annual increase is usually driven by Christmas Holiday spending, which is still to come.

Note: Almost without exception, online sales by brick ‘n mortar retailers are recorded along with their store sales in their regular channel. Whether they are up or down, their online sales are included in the totals.

Recap – Hopefully, April was the “bottom” in the COVID-19  impact on the American way of life and consumer spending. Although the situation began to improve slightly in May, it still beat out March to register the 2nd biggest year over year monthly retail sales decline in history. Restaurants, Auto and Gas Stations all had big sales increases over April, but they are still struggling. The Relevant Retail segment provided the only true positive as sales were up in all measurements. However, for many segments in this group there is still a long way to go. As the situation evolves, spending will no doubt move back to a more routine pattern – a new normal. No one knows how long that this will take and what long term impact the COVID-19 crisis will have on U.S. consumers’ spending behavior. We will continue to monitor the data and provide you with regular updates as the situation evolves.



The Impact of COVID-19 on Small Businesses – May Monthly Update

Small Businesses are at the core of our nation’s economy and the challenges they face are important to everyone. To better understand the impact of COVID -19 on these businesses, the U.S. Census Bureau began reaching out to small businesses in order to aid decision-makers in serving their urgent needs. For the Survey, the Census Bureau defined a small business as a single location business with employment between 1 and 499 and receipts of at least $1,000.

Consisting of 16 questions, this 5-minute survey reaches close to 1 million businesses split across a 9-week rotation to reduce burden and lessen survey fatigue. The survey is reaching out to small businesses in every area of the U.S. Economy. The first survey was conducted between 4/26/20 and 5/2/20. The most recent results are from the week ending 5/30/20 so we can now track the evolution of the COVID-19 impact across the whole month of May.

The results are first categorized by major, 2 digit NAICS code classification. Slightly more specific data (by 3 digit NAICS code) is now available so we are able to more closely track elements which are relevant to the Pet Industry. Here are the 14 “pet relevant” groups for which we have compiled data:

  • National Avg: Covers All Major Areas with a few Exceptions like Agricultural Production and Religious Organizations
  • Product Related Groups:
    • 31-33: Manufacturers – All manufacturers
      • 311 – Food Manufacturers (Both Human & Animal)
    • 42: Wholesalers/Distributors – Wholesalers/Distributors of any type products
      • 424 – Distributors of Nondurable Goods (Includes food and nondurable supplies)
    • 44-45: Retail Trade – This includes everything from gas stations to Pet Stores (#453910). No restaurants
      • 444 – Building Materials/Hardware/Farm
      • 445 – Food & Beverage Stores
      • 452 – General Merchandise Stores
      • 453 – Miscellaneous Retailers (includes Pet Stores)
      • 454 – Nonstore Retailers
    • Services Related Groups:
      • 54: Professional, Scientific and Technical Services – Legal, Advertising Agencies, etc… and Vet Clinics (#541940)
      • 81: Other Services – Funeral Homes, Barber Shops, Auto Repair, etc … and Pet Care Services (#812910)
        • 812 – Laundry & Personal Care (includes Pet Care Services)

The data from each group has been bundled into 3 charts showing the group’s responses to 8 particularly relevant questions about the impact of COVID-19.

Here are the charts and the questions that will be answered on each:

Chart #1: Impact of Covid-19 on Your Business

  1. Overall, how has this business been affected by the COVID-19 pandemic?

Chart #2: Key Business Elements – Weekly Changes

  1. In the last week, did this business have a change in operating revenues?
  2. In the last week, did this business have disruptions in its supply chain?
  3. In the last week, did this business temporarily close any of its locations for at least one day?
  4. In the last week, did this business have a change in the number of paid employees?

Chart #3: Government Assistance & Your Outlook For The Future

  1. Since 3/13, has this business requested/received financial assistance from Paycheck Protection Program (PPP)?
  2. Since 3/13, has this business received any financial assistance from any Federal Program?
  3. In your opinion, how much time will pass before this business returns to its usual level of operations?

We are not going to review each group in this report. We are going to take a closer look at the National Averages, Miscellaneous Retailers (includes Pet Stores) and Nonstore Retailers. At the conclusion of the report we will make the data for all 14 groups available for you to download. You can then pick the ones that are most relevant to your particular business.

A word of caution: Remember, this data is only for the small businesses in any particular classification. It doesn’t include the big chains, which could be impacted differently because of their size, capabilities or resources.

Let’s get started with the National Averages.

  • The perception of a negative impact remains high, 85+%, but it has become more moderate.
  • Not too many folks are seeing any positives, but the percentage seeing little or no effect has grown to 11.4%.

  • Every measurement on this chart is moving in the right direction. However, in terms of revenue businesses still have a very long way to go.
  • By the end of the month, more areas were reducing “lock downs” so the closures decreased, but still impacted over 1 in every 4 small business.
  • The employment situation also showed significant improvement. The gap between businesses adding and decreasing employees has narrowed.

  • Perhaps the most significant change is in the number of businesses receiving PPP funds. On May 2nd, 51% of businesses who had applied for PPP had received funds. By May 30th, this number had grown to 95%.
  • The other big change is that the projected time for recovery has increased, with 41.2% now saying a return to normal will take 6 months or more. Plus, 1 in every 10 businesses say that they will never return to “normal”.

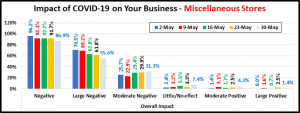
Now, let’s look at MISCELLANEOUS STORES

  • While Pet Stores were generally deemed “essential”, most stores in this group, like gift shops, art dealers and used furniture stores were not, which explains the high initial negative impact. It did moderate slightly over the month.
  • The numbers are still very small, but the percentage of businesses expecting a positive outcome (5.7%) or little/no effect (7.4%) on their business are both increasing.

  • The change in revenue started in the right direction but plateaued at mid-month. In the last week it appears to be moving back on track.
  • Supply chain problems remain a big factor. While closures are down significantly, they still impact almost 4 in 10 businesses.
  • The number of businesses with a decreasing number of employees has been cut in half. However, it is still twice the number of companies adding employees.

  • The PPP funds really rolled out in May to this group. On May 2nd, only 41% had received any $. By May 30th, that number had grown to 93%. In fact, 78% of all these businesses received some type of federal aid.
  • This group also sees a longer recovery time, with 44.5% saying that it will be 6 months or more until a return to normal. This is actually a little more optimistic than their feelings on May 23rd when a full 62.5% thought that a return to normal would take 6 months or more (46.1%) or actually never happen (16.4%).

Finally, let’s look at NONSTORE RETAILERS

  • Although the percentage dropped sharply in the last week of May, a large majority of businesses still see COVID-19 as a negative impact on their business. 12.1% said that the effect would be positive.

  • The revenue situation is improving rapidly. Almost 1 in 4 businesses saw an increase in revenue, but 42.5% are still reporting declining $ales.
  • Supply chain problems and closures are improving but 23.8% with closures is still high for businesses with no retail outlets.
  • The employment situation totally turned around in May. As of May 30, more companies are adding employees (9.0%) than are losing them (6.9%).

  • The PPP was delivered in May. By 5/30, 96% of the businesses who applied for funds had received payment.
  • Their overall projection for recovery is a little better than average. 6 months or longer still has the largest number (31.8%) but 60% of this group say that there was no impact on their business by COVID-19 or that recovery will occur within 6 months.

As you can see from our examples, while the specifics may vary by business category and the situation is generally improving, COVID-19 has had a broad negative impact across the full spectrum of U.S. Small Businesses. Even small businesses in channels that are showing overall growth during the crisis, like Grocery, Hardware and Nonstore, are having serious problems. The overall national growth in these channels is being driven by the “big guys”, like Kroger, Home Depot and Amazon. The overall projection for a return to normal for small businesses is 6 or more months, which would put it in December 2020 or later.

That concludes our May update, but as we said, more data is available for you. Files with the specific data/charts for all 14 business categories that we identified as relevant to the Pet Industry (including those used in this report) are available for download. Each file is a 1 page word document with 3 COVID-19 impact charts for a specific business category. There is no commentary – just data. Pick the ones that are most relevant for your business and share them with your associates. STAY SAFE!

National Average & Major Business Categories

National Avg Manufacturers Whlsrs/Distribs Retail Trade Science/Tech Other Services

More Defined Supply Chain Categories

Food Mfg Distrib Nondurables

Drilling Down into the Retail Trade

Bldg/Hdwe/Farm Food & Bvg Gen Mdse Strs Misc Stores Nonstore Retailers

Finally, Personal Care Services (includes Pet Care)


U.S. PET SUPPLIES SPENDING $17.71B (↓$2.10B): MID-YR 2019 UPDATE

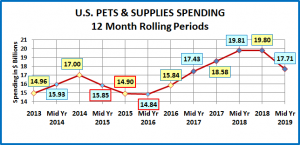
In our mid-year analysis of Pet Food spending, we saw that the spending plummeted in the 2nd half of 2018 then flattened out at the beginning of 2019. Pet Supplies spending took the exact opposite path. Mid-Year 2019 Pet Supplies spending was $17.71B, down $2.1B (-10.6%). The first half spending drop in 2019 effectively puts spending in this segment back to the level of 2 years ago in Mid-Yr 2017. The following chart should put the recent spending history of this segment into better perspective.

Here are this year’s specifics:

  • Mid Yr 2019: $17.71B; ↓$2.10B (-10.6%) from Mid Yr 2018. The -$2.10B came from:
    • Jul > Dec 2018: ↓$0.01B
    • Jan > Jun 2019: ↓$2.09B

Like Pet Food, Pet Supplies spending has been on a roller coaster ride. However, the driving force is much different. Pet Food is “need” spending and has been powered by a succession of “must have” trends. Pet Supplies spending is largely discretionary, so it has been impacted by 2 primary factors. The first is spending in other major segments. When consumers ramp up their spending in Pet Food, like upgrading to Super Premium, they often cut back on Supplies. However, it can go both ways. When they value shop for Premium Pet Food, they take some of the saved money and spend it on Supplies. The other factor is price. Pet Supplies prices reached their peak in September of 2009. Then they began generally deflating and in March 2018 were down -6.7% from 2009. Although it is not a hard and fast rule, Price inflation in this largely discretionary segment can retard sales, usually by reducing the frequency of purchase. On the other hand, price deflation generally drives Supplies spending up. Innovation can “trump” both of these influencers. If a new “must have” product is created, something that significantly improves the pet parenting experience, then consumers will spend their money. The perfect example of this is the successive waves of new food trends. Unfortunately, we haven’t seen much significant innovation in the Supplies segment recently.

Recent history gives a perfect example of the Supplies roller coaster. In 2014 Supplies prices dropped sharply, while the movement to Super Premium Food was barely getting started – Supplies spending went up $2B. In 2015, consumers spent $5.4B more on Pet Food. At the same time, Pet Supplies prices went up 0.5%. This was a “killer” combination as Supplies spending fell $2.1B. In 2016 consumers value shopped for Food, saving $2.99B. Supplies spending stabilized by mid-year then increased by $1B in the second half when prices fell sharply. Consumers spent some of their “saved” money on Supplies. Supplies prices continued to deflate throughout 2017. Food spending increased $4.61B in 2017 but this came from a limited group, generally older CUs, less focused on Supplies. The result was a $2.74B increase in Supplies spending. This appeared to be somewhat of a break with the overall pattern of trading $ between segments.

In the first half of 2018 Pet Food spending slowed to +$0.25B. Supplies’ prices switched from deflation to inflation but were only up 0.1% versus the first half of 2017. During this period Supplies Spending increased by $1.23B. With new Tariffs scheduled to start in September, prices began to climb in the second half of 2018. They were up 1.7% in the second half and with implementation of the tariffs, grew an additional 1.7% in the first half of 2019. Halfway through 2019 Supplies prices were a full 3.4% higher than they were a year earlier. The impact of the tariffs on the Supplies segment is very clear. Spending became flat in the second half of 2018, then took a nosedive in the 1st half of 2019 – down -$2.1B. In one 6 month period Supplies gave back 40% of the $5B it had gained from July 2016 to June 2018.

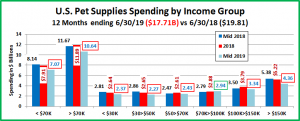
Let’s take a closer look at the data, starting with the two most popular demographic measures – age and income. In the graphs that follow we will compare spending for the Mid-year 12 months ending 6/30/19 to the previous period ending 6/30/18. In our graphs we will also include the 2018 yearend $pending. This will also allow you to see the spending changes in the 2nd half of 2018 and the 1st half of 2019.

The first graph is for Income, which has been shown to be the single most important factor in increased Pet Spending, especially in Pet Supplies and both of the Service segments.

Here’s how you get the change for each half using the $50>70K group as an example:

Mid-yr Total Spending Change: $2.43B – $2.47B = Down $0.04B (Note: green outline = increase; red outline = decrease)

  • 2nd half of 2018: Subtract Mid-18 ($2.47B) from Total 2018 ($2.61B) = Spending was up $0.14B in 2nd half of 2018.
  • 1st half of 2019: Subtract Total 2018 ($2.61B) from Mid-19 ($2.43) = Spending was down $0.18B in 1st half of 2019.

  • In an exact reversal of the Mid-yr 2018 pattern, the decrease in Supplies Spending was widespread across income groups. The only yearly increase came from the $70>100K group. They were up in both halves. They did have a $2B decrease in Food spending during this time so they may have spent a small amount of those $ on Supplies.
  • In another reversal, the biggest decrease came from the over $150K group. Their $1.02B drop accounted for 49% of the segment’s total decrease while they only have 13.1% of the CU’s. They gave back most of last year’s $1.5B gain but the drop was mitigated because this group is gaining members faster than any other income segment, +11.4%.
  • The pattern of the under $50K groups matches the $150K+ segment with drops in both halves. Their combined $1.03B drop also accounted for 49% of the total decrease. However, they account for 46.0% of all CUs and their numbers are shrinking, down 1.6 million, -2.7% in the last year.
  • The upper and lower middle income groups, $50>70K and $100>150K, had their own pattern with a lift in the second half of 2018 and a drop at the start of 2019. The $ changes were larger for the higher income group.
  • Did tariffs have an impact? Income groups totaling 113M CU’s (86%) spent less on Supplies in the 1st half of 2019.

Now let’s look at Pet Supplies spending by Age Group.

  • Every Age group had an overall annual decrease and only the under 25 group had an increase in the 1st half of 2019.
  • The 25>44 year olds were the only ones to spend more in the second half of 2018, +$0.32B. However, they gave it all back and more, down -$0.94B in the 1st half of 2019.
  • The two smallest spending groups, <25 and 75+ had only small decreases, under -5%. However, the Supplies spending in each of the other groups fell at least -9%. Obviously, the inflation from tariffs affected all ages.

Now let’s look at what is happening in Supplies spending at the start of 2019 across the whole range of demographics. In our final chart we will list the biggest $ moves, up and down by individual segments in 11 demographic categories. Remember, the drop in the 1st half of 2019 was -$2.09B, a big change from the -$0.01B decrease in the 2nd half of 2018.

  • The first thing that you notice is that the biggest decreases are radically larger than the biggest increases.
  • The downturn is also very widespread as in 5 of the 11 categories all segments decreased Supplies Spending. This is a radical turnaround from last year when 4 categories had increased supplies spending in all segments. The “flip” from last year is even more evident in the details. In the 1st half of 2018, 89% of all segments spent more on Supplies. In 2019, only 8 segments spent more. That means 90% spent less – a total reversal.
  • The list of losers is a veritable roster of the usual Supplies spending winners – Gen X, White, not Hispanic, Homeowners w/Mtge, $150K+, BA/BS, Suburban, 2 Earners… The answer is that the groups who buy the most Supplies were the groups most impacted by the price increases.
  • There are a couple of minor bright spots. Like the Food segment, Singles were the unexpected winners in 3 categories. This reflects their increasing focus on their pets. It also can be seen beneath the surface in the <25 and 75+ age groups. They had by far the smallest decreases and are also the most likely to be in a 1 person CU.
  • The other positive is that both African Americans and Hispanics increased their spending overall and in both halves.

The 24 month Spending winning streak for Supplies which began in the second half of 2016 came to an end in the second half of 2018. During that time spending on Pet Supplies increased $4.97B (+33.5%). It was also widespread across America. Of 82 separate demographic segments, only 1 spent less on Supplies in that period – the Greatest Generation. This 91+ year old group has now become too small to be accurately measured.

What are the market conditions that affect Supplies spending? We have to first note that the world changed for Supplies because of the great recession. Prices have generally deflated since then and spending in the segment became more sensitive to changes in price. Prices go up…spending drops, usually due to reduced purchase frequency. Prices go down… spending turns up. This situation did not exist prior to the recession.

The other factor is spending in other segments, especially Food. Pet spending comes out of “one bucket”. A big increase in one segment can result in a cut back in others and big savings can generate more spending. The recent upgrade to Super Premium Food was such a big $ commitment that it magnified this effect.

In 2018, something new was added – outside influence. The FDA warning on grain free dog food had an immediate and negative impact on the Food segment. For Supplies, it was the implementation of added tariffs. Although the tariffs were not official until September, prices in the Supplies segment began to turn up in the Spring. In the 2nd half they were 1.9% above 2017 and kept increasing. The 1st half 2019 CPI was 3.4% above the 1st half of 2018. The result was that Supplies spending flattened out then plummeted in the first half of 2019, down -$2.1B. Inflation has now come to the forefront in Supplies Spending. It continued to increase. By the 2nd half of 2019 prices had increased 4.0% in 18 months. Unless consumers adjust their behavior, this does not bode well for the 2nd half of 2019. We’ll get that data in September.