Attending SuperZoo 2019? – It is a great Opportunity! But….You Need a Plan!

The WPA moved the show back to the traditional late summer timing. Now, it is 5 months after GPE which helps “feed” the New Product Showcase with more entries. The exhibitor count is down slightly but the booths continue to get bigger. To help attendees in working this huge show the floor sections were expanded and 2 new sections were created – International and the Poultry Zone. One thing is unchanged. There is a huge array of exhibitors in every product category.

Consider these 2019 SuperZoo facts:

  • 1100+ exhibitors
  • 7 Floor Sections: Natural, Rodeo Drive, Groomers, Critter Alley, 1st Time Exhibitors, International, Poultry Zone
  • 269,000+ sq ft of exhibitor booths Plus, 30,000 sq ft to highlight: New Products, Made in USA and the Pet Tech Ctr.
  • Over 20,000 attendees with more than 10,000 buyers.
  • SuperZoo University: Seminars on Retail, Grooming and Animal Health – 110 hours; 82 separate sessions/topics
  • Almost 5 miles of aisles – just to walk the exhibit floor

Whew! This show is huge. The show floor is open for 22 hours so…         

Let’s “Do the Math!”

If you don’t attend any seminars, visit the New Product Showcase, stop to chat with anyone in the aisles or for food, a drink or to go to the bathroom and maintain a walking speed of 2.5 mph…

You can spend…1 MINUTE AND 5 SECONDS…with each exhibitor

You definitely need a plan!

With a higher concentration of Pet retailer attendees and a commitment to groomers, there are subtle differences between SuperZoo and GPE.  However, like GPE, SuperZoo has attendees from every major retail channel and attracts both exhibitors and attendees from around the globe.

Despite the variety of offerings to fill an attendee’s time, SuperZoo is still primarily about Pet Products. New Products are critical to maintaining and growing any business so you must take the time to visit the new product area. Knowledge is power so you should also sign up for any relevant classes. Sometimes it’s not what you know, but who you know that matters most. This makes networking with other industry professionals a priority.

Every business can improve in terms of products. If you are a retailer, what sections of your store are not doing as well as you hoped and need a “facelift” or conversely, what areas are growing and need products to fill additional space? Category managers for distributors and retail chains may only be interested in targeted visits to exhibitors relevant to their “categories”. Representatives may be looking for new manufacturers…in specific product categories. Manufacturers could be looking to find distributors to handle their products or just looking to “check out” the competition. In regard to products, there is always something to see…for everyone! Plus, there are 466 Exhibitors at SZ 19 that weren’t at GPE 19.

SuperZoo is a great place to review products but Business Services, everything from Private label to POS, have also become increasingly important. In fact, 1 out of every 8 exhibitors offers some type of Business Service. Attendees can now “Leave no stone unturned” in their quest for business success. SuperZoo is about gathering information and making decisions to improve your business – whether they are made on the spot or put on your “must do” list. Your only real limitation is time. How do you make the most effective use of your time on the show floor? Here’s a suggestion.

Use the Super Search Exhibitor Visit Planner to make SuperZoo easier and more productive. I initially designed it in 2014 and have updated the data and produced a new version for every GPE and SuperZoo since then…including SZ 2019.

The “update” is not just exhibitor lists but also to the product category offerings for every exhibitor. I reviewed every exhibitor profile on the show site, but I also visited over 1000 websites and conducted separate internet searches to “validate” their product offerings. It is not 100% accurate, but it is close.

What does the Super Search do?…It searches for and produces a list of Exhibitors by product categories.

  • From the simplest – “give me a list that I can look at on my phone or tablet in either Booth # order or alphabetically”
  • To the most complex…”can do a simultaneous search for multiple specific product categories, allowing you to personally narrow down the initial results and see the “final” alphabetically or by booth number.”

The SuperZoo Super Search Exhibitor Visit Planner does both…and more…and does it quickly! Take a look at the New Quick Start Guide. You will see that it looks complex but is really quite simple.

SUPERZOO 2019 Super Search Exhibitor Visit Planner – Quick Start Guide

The SuperZoo Super Search Exhibitor visit planner is designed to make your time on the show floor more efficient and more productive. With the Super Search you can conduct up to 5 separate and distinct product category searches simultaneously with consolidated results produced in booth # order to facilitate your “journey”. There are detailed instructions for reference and to help you understand the nuances of the tool. However, it is really very simple so let’s get started.

Here is the Dashboard where you set up your searches.

On the dashboard, the first things to note are the numerous category columns. There are 7 different floor sections (International & Poultry Zone are new.), 11 different Exhibitor or Animal Types and 33 Dog and/or Cat Product categories. (CBD Products was added this year.) You can search exhibitors for any combination of these.

Let’s take a specific example running 3 simultaneous searches for several Dog/Cat categories:

  • Toys
  • Treats
  • Catnip & Litter (Must sell both)

Now referring to the Dashboard, let’s take it by the numbers:

#1 – This column is where you activate each search. Type in a “Y” (Cells C3>C7 will auto-capitalize) This search “line” becomes active.(cell turns green) In our example we are running 3 searches so we have 3 “Y”s.

#2 – Now we enter a 1 in the correct column for each search line. Search Line 1: Toys; Search Line 2: Treats.

#3 – In Search Line 3 we want exhibitors that sell both Catnip and Litter so we put a 1 in both of these columns.

#4 – Now we just “click” the Execute Search Button. The searches are done simultaneously and the results combined into a single list in alphabetical order.

#5 – If you would like to view the list in Booth # order, just click the Booth # Sort.

#6 – You can switch the list back to an alpha view by clicking the Alpha Sort Button.

#7 – To Clear all your search categories and start a new search, click the Clear Criteria Button. Then click Execute (#4) again and you will be back to the full list

Note: Any Search Line with a Y and no 1’s in any column will always deliver the entire list regardless of what is selected in other lines. Change the Y back to an N in unused search lines. Now a sample of the results:

Company A – Has Toys Only; Company B has Dog Treats Only and is also a 1st Time Exhibitor at SuperZoo; Company C is on the list for Treats and also has Catnip, but no Litter. This is not unusual as Catnip is often a Treat; Company D has Treats & Toys. Company E has both Catnip and Litter and in fact, actually has it all!

Note: The Super Search highlights your search categories so you know “why you are there”. However, it also shows all categories that are available. Some might “pique” your interest while you are visiting the booth.

You can review the exhibitors alphabetically then put the list in Booth # order to make it easier to “work”. The Super Search also allows you to “cut down” the list during your review. (Pg 2; Point #11 – “U Pick ‘em” in Detailed Instructions) But First, I suggest that you “play” with the Super Search to get a “feel” for the tool, and then review the Detailed

Instructions. With your “play” experience, the detailed instructions will become a “quick read” and a valuable reference. You’ll soon be “up to speed” on the full capabilities of Super Search.

Good Luck and Good “Hunting” at SuperZoo 2019.

Ready to Start Planning?

Use the links below to download The Super Search (Be Sure to Enable editing/macros/content), the Quick Start Guide and the Detailed Instructions. Then GET STARTED!

(To save the PDF to your computer Right Click the download link and select “Save Link As…”)

(To save the PDF to your computer Right Click the download link and select “Save Link As…”)

(For the Excel file to work on your computer, be sure to enable macros/editing/content if asked.)

The Super Search has been updated to reflect exhibitors as of 8/16/19. The changes from 8/12 are highlighted in yellow. The changes from 8/5 to 8/12 are still highlighted in blue. The changes from 7/29 to 8/5 are still highlighted in pink. This is the “final” update before the show. Always look for the date in the file name to insure that you are using the most up to date edition of the planning tool.b


SuperZoo 2019 – It’s a great Opportunity and a Sure Winner!

SuperZoo 2019 is only a month away. It is most definitely a great “Opportunity” for attendees and exhibitors and the “surest bet” in Vegas. Like Global Pet Expo, SuperZoo is a “must do” if you want to be a player in the U.S. Pet Market.

There are differences between the two shows. After all, GPE started the U.S. Pet Industry with the first trade show 61 years ago. It is still the largest annual show and has a huge international following with 295 exhibitors from outside the U.S. On the other hand, SuperZoo traces its roots to a regional trade show for independent pet shops. It too has come a long way since those early days. SuperZoo has expanded both in size and its reach. With 1100 exhibitors, targeted special floor sections, including one devoted to the important grooming segment, and over 120 international exhibitors, it too has become a “destination” for manufacturers, distributors and key players from all retail channels. However, Independents are still a major focus of the show. This has a benefit for all attendees as “hopeful” new product offerings and trends often show up first at SuperZoo because Independents are generally more open to adding new, untried items than the larger chains and mass market retailers. You will see this in 2019 with the “explosion” in exhibitors offering CBD products. (With 63 exhibitors, I assigned CBD its own separate product category. It also earned 2 Educational Seminars.)

SuperZoo’s growth has not come without challenges. Recently, they have had to move the show dates twice, once last year to accommodate the need for more floor space and again this year to return to the expected and traditional late summer “timing” of the show. This caused a little “hand wringing” and 37.4% of 2018 exhibitors didn’t return. This is up from the “usual” 30%. (Note: GPE 2019 was 34%) Although down by 98, the final exhibitor count should again reach 1100, the benchmark set in 2016. The booths are also larger. Exhibitors will occupy 269,000 sq ft, with an average booth of 254 sq ft, up from 245 in 2018 and 200 in 2016. Plus, the New Product Showcase this year will cover 30,000 sq ft.

Let’s take a closer look. We’ll start with some overview exhibitor trends then move to the special floor sections.

  • Assigned Exhibitors: 1096; ↓ 98 (-8.2%) from 2018
  • Booth Sq Ft: 269,000; ↓ 15,000 (-5.3%) from 2018
  • 447 SZ 2018 Exhibitors (-37.4%) aren’t at SZ 2019
  • 352 (32.1%) are new. They didn’t do SZ 2018
  • 462 (42.2%) SZ 2019 Exhibitors weren’t at GPE 2019
  • 261 (23.8%) are really new – Not at SZ 18 or GPE 19

  • You first notice that the count in Special Floor sections grew 20.6% while the overall exhibitor count fell by 8.2%. Once the exhibitor count reached the 1100+ range, defined floor sections became increasingly important for both exhibitors and attendees. After falling to a 36.6% share last year, they are back to a more normal level – 48.1%.
  • Every special section but Groomers has more exhibitors than last year. The Grooming segment is still very important, but it is becoming even more competitive and exhibitors are becoming more widespread across the show floor.
  • The 1st Timers section grew 43.2% but remember that 352 exhibiting companies weren’t at SuperZoo 2018 so the 106 doesn’t reflect the true count of new exhibitors.
  • The Natural Section is still growing as this trend continues to be strong in the marketplace.
  • Function is the biggest trend, but Fashion is still important, and Rodeo Drive is back to a more representative size.
  • Like every element of the marketplace, SuperZoo is evolving. They are extending their “reach” with an International Section. Although this doesn’t reflect their coverage as there are over 120 International exhibitors at SuperZoo 2019.

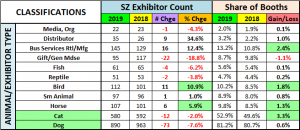
Now let’s look at the Exhibitors by type, including animal.

  • Remember there was a 8.2% drop in exhibitors so the most accurate measure of trends may be the change in share.
  • All animal types gained in share which is appropriate as the industry’s focus is pets. Birds, small animals and horses even increased their booth count. Fish gained the least in share while cats continue to “claw their way up”, +3.3%.
  • The importance of pet retailers at the show is very evident by the 34.6% increase in Distributors.
  • Gifts/Gen Mdse/Uncategorized exhibitors fell sharply and is down -31.7% from their peak of 139 exhibitors in 2016.
  • The rise of Business Services continues as a major trend – up 16 (+12.4%) from 2018, but up 96 (+202%) from 2014.
  • As always, Dogs and Cats are the royalty, but the Cat share of exhibitors has grown markedly – up from 44% in 2014.

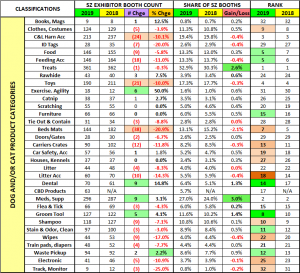
Let’s take a closer look at the “royalty”. Here are the top 10 Dog and/or Cat Categories at SuperZoo 2019.

  • The members of the top 10 are unchanged from 2018. There was a shuffling in the rankings from #5 to #10 – 3 moved up while 3 dropped, but basically, they all “held their ground” in their importance.
  • The big news is the seemingly unstoppable momentum of Meds & Supplements. This category has also helped drive Treats to its unparalleled prominence at #1 as Supplements are often produced in Treat form. They again rank #1 & #2 in terms of exhibitor count, which is up 57% for Treats and 84% for Meds & Supplements from 2014. Amazing!
  • The importance of grooming is showcased here as 2 related categories are in the Top 10. In fact, Grooming Tools was 1 of only 2 categories in the Top 10 to increase exhibitor count in 2019.
  • Food maintained its prominence, gaining in share and ranking although falling slightly in numbers.
  • Beds had the biggest decrease. It raises the question, “Can attendees “survive” with only 144 booths offering beds?”

SuperZoo is down 8.2% in exhibitors, equal to 2017 and 17% more than 2014. The Average Booth is also 25% larger than 2016 and still growing. There are products and services available to fill virtually every need or want of the attendees and the show is keeping “in tune” with changes. Increasing the number and size of special floor sections along with the big increase in educational sessions are prime examples.

924 exhibitors (84%) focus on Dog/Cat. Let’s take a closer look.

There are 98 fewer Exhibitors at SuperZoo. Those offering Dog and/or Cat products fell by 76. However, the Dog/Cat share increased slightly from 83.7% to 84.3%. Once again “share” may be the best measure for comparison.

  • Only 10 of 33 (30%) Dog/Cat categories have more exhibitors in 2019 than in 2018
  • However, 23 of the 33 (70%) categories increased their share of exhibitor booths

In the Top 10 categories we saw a big loss in numbers and share by Beds, but Medication/Supplements and Grooming Tools gained ground in both measurements. Treats are down 1 in exhibitor count but up 2.6% in share. There are only 2 other significant gains in the other Dog/Cat categories:

  • Dental: +9 (+14.8%); Share ↑1.3%
  • Exercise/Agility: +6 (+50.0%); Share ↑0.6%

When you look at the Dog/Cat Categories making gains, you see that the most common thread is the health and wellness of our companion animals. We also can’t forget the recently added category of CBD products, which debuted with an exhibitor count of 63. All of these fit right in with the ongoing trend to more nutritionally focused Pet Food.

SuperZoo certainly showcases what is “happening” in the Pet Industry and offers a great opportunity for attendees and exhibitors to make a mutually beneficial connection. Once again, it’s the surest bet in Las Vegas!

Finally, the chart below details the specifics for all 33 of the Dog/Cat product categories that I defined for the Super Search Exhibitor Visit Planner.  (Note: The SZ 2019 Super Search will be released next week, no later than 7/30/19.)

TAKE A LOOK. I HOPE TO SEE YOU IN VEGAS!


U.S. Retail Trade – 2018 $ales by Channel – Going for the Gold

The Total U.S. Retail Market in 2018 reached $6.03 Trillion dollars – up $282B (+4.9%). This is slightly better than last year’s (+4.3%). For this report, we will focus on the “Relevant Retail” Total – removing Restaurants, Auto and Gas Stations from the data. This segment totals $3.6 Trillion. We should also note that in 2018, Gas prices continued to increase. As a result, for the second consecutive year there was an increase in revenue in all these major segments.

How are specific Retail Channels performing? We’ll start with a market overview and then work our way down.

(Base Data is from the U.S. Census Bureau Retail Trade Report)

Remember: This data is very relevant to the Pet Industry. According to the last Economic Census:

  1. Retailers other than Pet Stores generated 66.5% of all the Pet Products revenue in the U.S.
  2. Pet Products, on average, generated 1.94% of the total revenue of all non-pet stores that chose to stock them.

  • Restaurants (Food Service) – 11.9% of Total Retail – Up $40B, +5.9%, which was double last year’s (+2.7%).
  • Automobile Sales – 20.4% of the Total – Revenue grew $35B, +2.9%. The growth is significantly slowing.
  • Gas Stations – 8.5% of the Total – Up $60B, +13.2% from 2017. Gas prices turned up in March of 2016 and continued to increase until turning downward in November of 2018. This again drove a major increase in $.
  • Retail, Less Food, Auto and Gas – Up $147B, +4.3% to $3.6 Trillion, better than last year’s +4.0% but once again less than the total market. This segment is 59.2% of the Total U.S. Retail market.

To put this year into perspective, let’s look at the overall performance over the last 5 years.

The U.S. retail market has grown each year since 2013 but each segment has a different pattern. The low point for the total came in 2015 due to a precipitous drop in gas prices. However, with a big turnaround in gas prices beginning in May of 2016, the growth rate of the overall market has returned to more normal levels. Restaurant sales growth had been slowing since 2015 but came back strong in 2018. Auto sales are still strong, accounting for 1/5 of the total market but the growth is definitely slowing. Our “Relevant Retail” Segment has been the most consistent, at or near 4% growth each year. However, we should note that after 4 consecutive years of exceeding the growth rate of the total market, its growth rate didn’t meet this standard for the second consecutive year. It will still serve as a benchmark as we review the individual channels. Above 4.3%, a channel is gaining market share. Below 4.3%, they are losing ground.

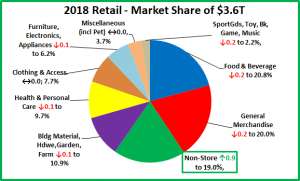
Now, we’ll slice up the U.S. “Relevant Retail” Channel “Pie”

These are large slices of the U.S. Relevant Retail pie. If you look closely you will see a troubling situation. 2 divisions maintained their share but 6 lost ground. In fact, only Non-Store retailers increased their share of the total retail market. Three divisions – General Merchandise Stores, Food and Beverage and Non-Store account for 59.8% of the total. This is up slightly from 59.3% in 2017. However, the increase is all due to Non-Store Retailers. The other two major segments continue to lose market share. All three are very important to the Pet Industry. Based upon the last U.S. Economic Census, these three major divisions produced 59.7% of total Pet Products sales. Consumers spend a lot of money in Pet Specialty Stores – 33.1% of their Pet Products $. However, they spend over 80% more in these 3 major retail channels. Pet products are “on the list” wherever the consumer shops.

Because they are so huge, major Divisions of the market generally don’t show much movement in market share in just one year so the changes in General Merchandise, Food & Beverage, Non-Store and Sporting Goods are very significant. Each of the major divisions includes a number of sub segments. For example, General Merchandise includes Traditional Department Stores, Discount Department Stores, Supercenters and Clubs as well as $ and Value Stores. These specific retail channels can have even greater movement in share because this is the level that the consumer “views” when making their initial shopping choice. Change at this level is where any ongoing consumer shopping migration first becomes apparent.

Here is the Market Share change “Rule” for 2018: To gain 0.1% in Market Share your $ increase must exceed the amount generated by a 4.3% sales increase PLUS an additional $3.6B. Example: If a channel did $100B in 2017, they need to do $100 +$4.3 + $3.6 = $107.9B to gain just 0.1% in 2018 share. You will see channels with revenue increases that still lose share because the increase was less than 4.3%. It shows that even small changes in share are significant.

With that overview, we’re ready to drill deeper into the data. Let’s look at the 2018 performance of some of the specifically “Pet Relevant” Channels to see which are doing the best…and worst in gaining consumer spending. Eleven of the twelve were chosen because they generated at least 1% of the Total Pet Products (food & supplies) spending in the last Economic Census – 2012. I have also included Traditional Department stores on the list. Even though they have never truly embraced Pet Products, they have long been a fixture in the U.S. Retail Marketplace. Their continued decline, as consumers migrate to outlets which better fit their needs, has profoundly affected U.S. retail shopping as generally they were the “anchor” stores for the Shopping Malls across America.

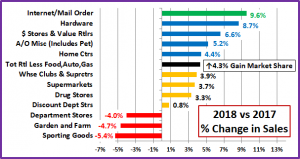
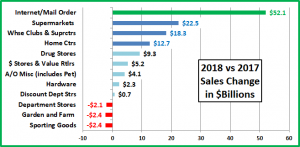
We will use 2 separate graphs to illustrate the situation in these Pet Relevant Channels. The first will show the % change in sales in 2018 vs 2017. The next will “show us the money” by translating the percentages into $ gained or lost. Then we will have observations on each segment.

Remember, you must be up at least 4.3% or you’re losing market share!

9 of these pet relevant channels are showing increased sales. However, in market share, 5 are gaining, but 7 are losing. Hardware stores is a surprise on the plus size. The market share losers include the traditionally largest channels plus Farm Stores, last year’s leader. In the next chart, we’ll “show you the money!” Remember, the Total increase for the “Relevant Retail” Market was $147B and you must be up 4.3% PLUS $3.6B just to gain just 0.1% in Market Share.

The continued, spectacular growth of the Internet is obvious as the $ increase in this segment was equal to the combined increase of Supermarkets, SuperCenters/Clubs and Home Centers. The revenue from Home Centers and Hardware is also still growing as weather related property damage continues to be a major problem. Consumers again turned their time and resources to repairing their homes. The continued strong increases by $ Stores is evidence that consumers want value plus the convenience offered by these smaller outlets. The A/O Miscellaneous segment is holding its own as consumers desire more personalized service in certain categories – like Pet Products.

OBSERVATIONS BY CHANNEL (Note: % of Total Business from Pet Products for stores that stock Pet)

  • Internet/Mail Order – $597.1B, Up $52.1B (+9.6%) – 35.4% of the total increase for the $3.6T Relevant Retail Market came from Internet/Mail Order. The Consumer Migration to this channel continues. – +0.8% in Market Share. They passed SuperCtrs/Clubs in 2016. Soon they will take the top spot from Supermarkets. (1.2% Pet)
  • Super Markets – $632.0B, Up $22.5B (+3.7%) Despite increasing sales, this largest sub-segment continues to lose ground. Sales are up $58B since 2014 but Market Share is down 0.94%. The Internet/Mail order channel has increased focus on grocery products and is pushing very hard to become the leading retail channel. (1.6% Pet)
  • Department Stores – $52.0B, Down $2.1B (-4.0%). Their decline continues. 50 years ago, they “ruled” the GM category. However, they failed to adapt to the changing wants and needs of the consumer. One small example of this is their failure to address America’s growing relationship with our companion animals. (N/A Pet)
  • Discount Department Stores – $97.0B, Up $0.7B (+0.8%). The rise of this segment started the downhill slide of Department Stores but their tenure at the top of GM was relatively brief as the SuperCtrs/Clubs offered true 1 stop shopping. Now, they have the Internet to contend with. Sales have stabilized, but not a good outlook. (2.3% Pet)
  • SuperCenter/Club Stores – $481.3B, Up $18.3B, (+3.9%). These outlets, with their broad mixture of grocery and general merchandise…at great prices, quickly became a dominant force in the retail market – second only to Supermarkets in Market Share for many years. In 2016 they were passed by the internet. Consumers still like them as their sales are still growing, but not enough. They continue to lose market share – Down 0.05% (2.4% Pet)
  • $ & Value Stores – $83.8B, Up $5.2B, (+6.6%). – A Great Value and easy to shop – 2 of U.S. Consumers’ major “wants”. This segment has shown steady growth in recent years and got even stronger in 2018. (4.3% Pet)
  • Drug Stores – $286.2B, Up $9.3B, (+3.3%). There still is a lot of turmoil in this segment. Intense competition has led to a large number of mergers and acquisitions, which have slowed growth. (0.3% Pet)
  • Sporting Goods – $42.2B, Down -$2.4B, (-5.4%). A Minor player in Pet. The turmoil in the category continues with mergers, acquisitions and store closings. (N/A Pet)
  • Home Centers – $300.1B, Up $12.7B, (+4.4%). These large, “project driven” outlets have never done a significant Pet Business. The top 2 retailers – Home Depot and Lowes, continue to drive the growth. (0.6% Pet)
  • Hardware – $28.4B, Up $2.3B, (+8.7%). Extensive weather damage in the past 2 years has had a huge impact on this channel, turning sales sharply upward after years of slow or even flat growth. (2.6% Pet)
  • Farm and Garden Stores – $48.6B, Down -$2.4B, (-4.7%). This segment has been growing in recent years in both overall sales and in Pet, but it was largely driven by Tractor Supply. However, even a strong increase by TSC in 2018 couldn’t overcome the decline in sales from other outlets. (8.9% Pet)
  • A/O Miscellaneous Stores $82.2B, Up $4.1B, (+5.2%). Florists, Pet Stores, Art Dealers…are typical of the segments bundled into this group. Pet Stores account for over 20% of the $ in this segment. These stores, whether chain or independent, tend to be small to medium in size. Their increase slightly exceeded the market so these stores, which focus on another consumer trend – a more personalized shopping experience, are “holding their own” against the large format retailers and the internet. +0.1% in share since 2014. (Pet Stores $ are 91% Pet Products)

The chart below puts the Market Share of each of these segments for 2018, 2017 & 2016 in a visual format so that it is easier to appreciate the relative sizes. Growth in share since 2016 is indicated by a green box, a decline is boxed in red.

Now we’ll wrap it up with a brief summary and a detailed chart for future reference.

SUMMARY 

Pet Stores remain the #1 channel for Pet Products. However, in the Relevant Market, there are 3 Olympic Medalists. SuperCenters & Clubs are firmly entrenched with the Bronze medal. The big race is for the Gold. In 2014, SuperMarkets led the Internet/Mail Order Channel by 6.1% in market share. In 2018, the lead was down to 0.97%. Barring a major turnaround, Internet/Mail Order should become the #1 retail channel in the U.S. in 2019. Amazon, the largest retailer in the segment, has firmly set their sights on the fresh grocery business. Supermarkets are trying to fight back by creating online ordering programs. However, this is probably too little, too late to stave off the internet juggernaut.

The annual increase in the Relevant Retail market has grown in recent years from +3.5% in 2015 to +4.3% in 2018. However, for the second consecutive year the increase in the “Relevant Retail” market was less than the increase in the Total Retail Market, +4.9%. This was again due to a big increase in Gasoline prices which drove up sales in Gas Stations. Once again. the Internet/Mail Order Channel provided much of the excitement and 35.4% of the growth in Relevant Retail. SuperMarkets, SuperCenter/Clubs and Home Centers generated 36.4% of the increase, but only Home Centers gained market share and that was only +0.01%. Traditional Department stores continued their decline while sales in the easy to shop and save, $ Stores grew. The small to medium A/O Miscellaneous Stores (Includes Pet) maintained their place in the market by appealing to consumers desiring a more personalized shopping experience.

The U.S. Retail Market continues to grow and evolve as the consumer migrates to the channels which best fulfill their current wants and needs. This is not a new phenomenon. It has always been that way. Currently, the “Channel of Choice” is Internet/Mail Order and their victory appears to be inevitable and coming soon. Traditional Brick ‘n Mortar stores will not go away but they must adapt to the new “electronic” environment if they wish to survive.

Finally, the Chart below contains Detailed 2016 > 2018 Sales Performance Data for over 30 U.S. Retail Channels.