U.S. E-Commerce $ales: Taking A Closer Look
The internet has become a huge part of our lives, affecting all aspects of our behavior, not the least of which is retail spending. U.S. consumer spending is driven by value, convenience and selection. This is a near perfect match of the “game plan” of the internet. As a result, the evolution of the retail market is accelerating as increasing numbers of consumers, across an ever broadening range of demographics, migrate to internet retailers. Brick ‘n mortar retailers are well aware of this movement and continue to increase their commitment to the .com divisions of their businesses.
In this report we will take a closer look at the total E-commerce business in the U.S. This includes sales from non-store retailers as well as the internet sales from the .com divisions of companies who derive most of their business from brick ‘n mortar outlets. We accomplish this by combining data from 4 separate reports published by the U.S. Census Bureau.
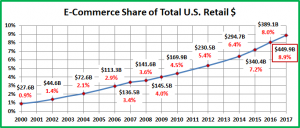
In 2017, E-Commerce sales were $449.9B, up $60.8B (+15.6%). The first chart will put those numbers into a historical perspective. In 2000, the Total Retail economy – less restaurants, was $3.0 Trillion. By 2017, it had increased 70.1% to $5.1 Trillion – an annual growth rate of 3.2%. During the same period, E-commerce sales increased by over 1500% – an annual growth rate of 17.8% – nothing short of spectacular. As you will see, the report is very “chart intensive”. This makes the data easier to digest and often reduces the need for commentary as the conclusions are visually very obvious.
The increase has been very consistent since the millennium, with the only slow down coming in 2008 and 2009 as a result of the Great Recession. However, while e-commerce growth notably slowed, we should remember that the total retail economy actually decreased in 2009 for the first time since 1956. 2010 and the years since the recession have shown strong increases in E-commerce as the new “value conscious” consumers looked to the internet for savings. Perhaps even more significant than the spectacular growth in dollars, is the growth in overall market share. Since 2000, E-commerce has moved from insignificance – less than 1%, to a 9% “force” in the retail market.
We see the annual dollars but are they consistent year round? Is there a pattern to E-commerce sales? The following graph shows what the sales looked like by calendar year quarter in 2017.
Changes in share from 2016
4th Quarter – Up 0.2%; 2nd Quarter – Up 0.1%;
3rd Quarter – Down 0.1%; 1st Quarter – Down 0.2%
The 4th quarter holiday lift for 2017 was +38%, up from +33% in 2016. However, the quarterly spending pattern seen in the chart above has been remarkably consistent, within 1%, for every year since 2000, with one exception. The 4th quarter of 2008 was only 28% of the year’s total. Consumer anxiety over the impending economic crisis reduced holiday spending that year. However, the pattern returned to “normal” in 2009.
Now let’s take a more detailed look at E-commerce sales. Last year the Census Bureau started breaking the E-commerce $ down by retail channel so we can see how the brick ‘n mortar companies are doing in their online battle with non-store retailers. Because of the detailed nature of the data, there is a lag time. This chart documents 2016 $ales.
In 2016, E-Commerce Sales increased $48.7B (+14.3%) over 2015 so it was another strong year for online shopping. Every channel but Health & Drug stores increased their E-commerce $, but only 4 channels gained in share. These “winners” are boxed in green. All 4 of these retail channels are very important to the Pet Industry. In the last Economic Census, they accounted for 65% of all Pet Products sales in the U.S. Here are their E-commerce specifics:
- Food & Beverage Stores – E-Comm. – $3.9B; Up $1.7B (+63.1%) – Share of e-commerce went from 0.4% to 1.0%. This huge percentage increase is a foreshadowing of even bigger things to come.
- Bldg/Hdwe/Gard/Farm – E-Comm. – $9.8B; Up $1.5B (+18.1%) – They gained 0.1% in share. It demonstrates that E-commerce is an option for all retail channels.
- Gen Merchandise – E-Comm. – $27.6B; Up $5.0B (+22.1%) – The internet is perhaps the single biggest threat to this channel. They are responding, gaining 0.5% in share.
- Non-Store Online Retlrs – E-Comm. $227.6B (+17.9%) – They started it all and continue to set the pace,+1.8% share.
Let’s also take a closer look at another channel of interest to the Pet Industry.
- Misc (Office, Florist, Gift, PET) – E-Comm. $13.9B (+2.2%) – This channel ranks 5th in share of E-commerce business among brick ‘n mortar outlets but they loss 0.4% in share. Pet Stores increasingly offer an E-commerce option but recently their emphasis has been on increasing services, like grooming, which are not available online.
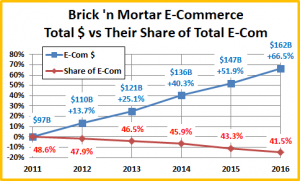
In 2016, Non-store retailers won the online “battle for the bucks” with their brick ‘n mortar rivals by a margin of 58.5% to 41.5%. Let’s look at recent history to see how this war is going.
The E-commerce sales for primarily brick ‘n mortar businesses increased $65B (+67.0%) between 2011 and 2016 but their share of total E-commerce sales fell from 48.6% to 41.5% – a 14.6% decrease. Brick ‘n mortar stores, from major chains down to independent retailers have increased their emphasis in online sales but they are not keeping pace with their non-store competition. In addition to not being as experienced in this market, another handicap that they often faced was that consumers were required to pay local sales taxes on purchases in any state in which the seller has a physical facility – retail outlets, offices or a warehouse/distribution center. No change in this for 2017, but in 2018 the U.S. Supreme Court reversed a previous ruling so the future competition may take place on a more level playing field.
Business success is usually dependent upon commitment. Just how important are E-commerce sales to any given retail channel? This final chart shows the E-commerce share of the 2016 total sales for each relevant retail channel.
The E-Commerce share of their total $ increased for 8 of 11 channels. Miscellaneous and Auto Parts stores both maintained their share but Health/Drug Stores loss ground. The single biggest gainer was Electronics/Appliances, +2.3% in share. The internet is a great place to shop for electronics. Two other significant gainers are General Merchandise (+0.7%) and Food & Beverage stores (+0.3%). These 2 channels account for 28% of the $5 Trillion retail market so any increase is very significant. Plus, there are undoubtedly more gains in E-Commerce still to come from these retailers.
Of particular interest to the Pet Industry are Miscellaneous Stores, which includes pet stores. While they ranked 5th in total E-commerce sales $, they finished in 2nd place for brick ‘n mortar channels in terms of the E-commerce share of the total channel’s business. The commitment to E-commerce is still strong in this channel.
Also note, traditional mail order and TV are not dead. They still account for 32% of the sales of all non-store retailers. However, it is E-commerce that is changing the retail marketplace and sales growth is still strong:
- 2017: +15.6%;
- YTD September 2018: +15.3%.
In this rapidly evolving environment, retailers must either adapt or face extinction. It’s their decision.


