2017 U.S. PET FOOD SPENDING $31.11B…UP↑ $4.61B
In 2017 The U.S. Pet Industry had a year that can best be described as Spectacular. Spending skyrocketed to $77.13B, up $9.84B (+14.6%). The good news was widespread as the 3 largest industry segments registered double digit increases. The only sour note was a slight decrease in Pet Services spending. Here are the specifics:
- Pet Food – $31.11B; Up $4.61B (+17.4%)
- Pets & Supplies – $18.58B; Up $2.74B (+17.3%)
- Veterinary – $20.67B; Up $2.56B (+14.1%)
- Pet Services – $6.77B; Down $0.07B (-1.0%)
However, as we have learned, the industry truly is a “sum” of its integral segments. Each segment has very specific and often very different buying behavior from the many consumer demographic segments. For this reason, we’re going to analyze each of the industry segments first. This will put the final analysis of Total Pet Spending into better perspective. Note: The numbers in this report come from or are calculated by using data from the current and past US BLS Consumer Expenditure Surveys. In 2017, this was gathered by the U.S. Census Bureau from over 42,000 interviews and spending diaries. The final data was then compiled and published by the US BLS.
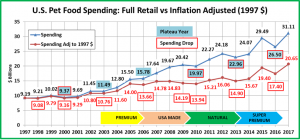
We will start with the largest Segment, Pet Food (and Treats). In 2017 Pet Food Spending totaled $31.11B in the U.S., a $4.61B (17.4%) increase from 2016. This was the second largest increase in history, trailing only the +$5.4B lift in 2015. While the size was somewhat of a surprise, the increase was expected after the drop in 2016. As you recall, in a detailed historical analysis conducted last year we discovered a distinct pattern in Pet Food Spending. The following chart documents annual Pet Food Spending since 1997 in full Retail Dollars and adjusted for inflation.
The pattern begins in 1997. Retail Pet Food Spending increases for 2 consecutive years then reaches a plateau year or even drops. There is a notable exception – the period from 2006 to 2010. During this time, there were two traumas which directly impacted the Pet Food Retail market. The first was the Melamine recall, which resulted in radically increased prices as consumers insisted on made in USA products with all USA ingredients. The second affected everyone – the great Recession in 2009. This was the first time that annual U.S. retail spending had declined since 1956. The net result was that the plateau period was extended to include both 2009 and 2010.
Pet Food seems to be driven by short term trends. A new food trend “catches the consumers’ attention” and grows…for 2 years. Then sales plateau or even drop…and we’re on to the next “must have”. The increases have become more pronounced in recent years and the whole situation has gotten even more complicated since 2014. That was the year that Food prices began an extended period of deflation due to an unprecedentedly competitive market.
After consumers choose to upgrade to a more expensive pet food, their #1 priority becomes, “Where can I buy it for less?” The internet entered this battle in a big way and “value shopping” was a major contributing factor in the big spending drop in 2016.
The internet also contributed to the 2017 lift in Pet Food spending by making the higher priced, upgraded foods more affordable to a wide swath of households. Super Premium was the obvious name for the last trend, which is continuing and expanding to include options like customizable, micro-targeted, ancestral and even DIY.
Pet Owners became Pet Parents in the 90’s. We took it a step further after the turn of the century and began truly humanizing our pets, especially our canine children. This trend is very accurately reflected in the evolution of Pet Food. We became increasingly more conscious of fulfilling the health needs of our pets, beginning with the first move to premium foods in 2004. This ramped up considerably after the Melamine scare in 2007. Now consumers read pet food labels, research ingredients and expect their pet foods to meet the same quality standards as the best human foods.
Just like the spending drop in 2016, the big lift in spending 2017 fits the pattern. Now, let’s look at some specifics. In 2017, the average U.S. Household (pet & non-pet) spent a total of $239.66 on Pet Food. This was a 17.1% increase from the $204.71 spent in 2016. This doesn’t exactly “add up” to the 17.4% increase in total Food Spending. With additional data provided from the US BLS, here is what happened.
- 0.3% More U.S. households
- Spent 15.1% more $
- 1.8% more often
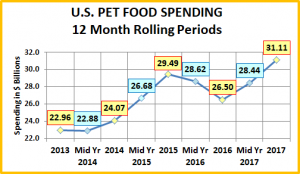
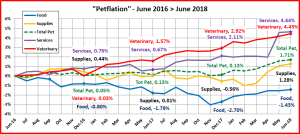
By the way, if 68% of U.S. H/H’s are pet parents then their annual Pet Food Spending is $352.44. Let’s look at a rolling history of Pet Food Spending over the course of the “Super Premium Cycle”.
Pet Food Spending dipped in the first half of 2014. This corresponds to the beginning of a 3 year deflationary period in this segment. During deflation, in a “need” category like Food, you don’t buy more, you just spend less. The spectacular lift in Pet Food Spending beginning in the second half of 2014 came from a fundamental change in spending behavior. Consumers began to buy more Super Premium Food and Med/Supplements in Treat form, all of which cost more.
An increasing number of consumers chose to upgrade their Pet Food and spending peaked in 2015. Then spending began to fall in the first half of 2016 and the decline intensified in the second half. At first it appeared that consumers were backing down on the upgrade. As it turns out, they were just applying the #1 driver in their buying behavior since the great recession – price (75%). They began shopping for value and there were plenty of bargains to be found.
The Pet Food market had become incredibly competitive between manufacturers
- Of course, initially the manufacturers of “regular” pet foods were trying to keep consumers from upgrading or to “buy back” those that switched. That is still an ongoing battle, but things quickly got more heated.
- The spending lift due to the move to Super Premium foods and supplements caused an explosion in the number of companies competing in this segment. To best illustrate this situation, let’s take a look at GPE and SZ exhibitors.
This chart shows the number of GPE and SZ exhibitors offering food or treats for dogs and/or cats from 2014>2018.
- The % increase is from 2014 to 2018. Ranging from +33% to +58%, the competition has obviously gotten fierce.
- The Treat companies began their growth in 2015 (especially at GPE) and it has continued right through 2018.
- The lift in the number of food manufacturers did not start until after the big consumer spending increase in 2015. Obviously, more companies wanted a piece of the action. Most of the growth in the numbers of Pet Food came from 2015 to 2017 which created the highly competitive market and helped fuel the -1.1% deflation in 2017. This radically increased “profit pressure”. In 2018 the growth in numbers slowed markedly and we have also seen a large number of mergers and acquisitions. This may help to stabilize both the number of companies and prices in this segment.
The competition starts between manufacturers, but the actual battle for the Consumers’ Pet Food $ is fought between retailers and now, even whole retail channels.
According to the Economic Census, most Pet Products (67%) are sold in non-pet store outlets. However, Pet Stores have traditionally been the primary purveyors of specialty foods and treats. This exclusivity protected them from battles with Mass Market outlets. The recent consumer movement to super premium and the resulting huge lift in spending has changed all that.
- Super Premium Pet Foods are significantly higher priced products which Pet Parents need every day without fail. With lower prices due to lower overhead, the internet offers big savings in $ and the convenience of regular, free home delivery. Is it any wonder why the internet has become a big player in this category?
- Some Premium brands are also moving to the mass market in an effort to reach more consumers.
- Large Mass Market retailers are developing their own private label premium brands.
- Pet Stores still have the advantage of being more flexible in their merchandising so they can respond more quickly to new trends and new products. Consumers also currently prefer to make major buying decisions on pet products in store, rather than online. This protects pet stores, at least initially, during the trial period of the food buying cycle.
I think that it is pretty safe to say that there were bargains readily available in Pet Food last year. In fact, 2017 was just a continuation of the most price competitive Pet Food market in history – across all of its segments.
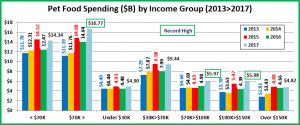
Now let’s look at some specific 2017 Pet Food Spending Demographics. First, we’ll look at income. This is the most influential demographic in Total Pet Spending. In the past, it was less dominant in Food. However, the move to Super Premium has brought it more to the forefront. We will show the annual spending from 2013 through 2017. This will put the 2017 numbers into better perspective and allow you to see the cyclical nature of Pet Food Spending.
The 2017 National Numbers were – $31.11B (a new record); Up – $4.61B (+17.4%); 2013>2017 – Up $8.15B (+35.5%)
- All of these large Income Groups increased their Pet Food spending in 2017. This didn’t even happen in the big 2015 lift. However, only two individual groups – $70>$100K and $100>$150K, set new, all-time pet food spending highs. The other 3 were slightly below 2015.
- Under $70K: In 2017 (61.6% of H/Hs) – $181.18 per H/H – $14.34B; Up – $1.88B (15.1%). As incomes rise, the number of H/H’s in this segment has been shrinking. The move to significantly higher priced Super Premium foods also had a major impact. In 2015, for the first time, the under $70K group spent less than 50% of Pet Food $.
- Over $70K: In 2017 (38.4% of H/Hs) – $331.06 per H/H – $16.77B; Up – $2.73B (19.5%). The spending pattern of this higher income group is remarkably similar to the under $70K group. However, in today’s “premium” food environment, the higher incomes continue to gain share of total pet food $.
- Under $30K: In 2017 (30.2% of H/H’s) – $133.37 per H/H – $4.9B – Up $0.42B (+9.4%). Obviously this group is very price sensitive. It is also getting smaller. The number of H/H’s was down 2.6% in 2017 and 8.9% since 2013. This decrease masks the true food situation. Their Total Food $ are up 9.1% since 2013, but their average H/H food spending is up 25.2%. This group still has an ongoing commitment to their pets.
- $30K>$70K: In 2017 (31.4% of H/H’s) – $222.57 per H/H – $9.44B – Up $1.46B (+18.3%). The spending for this group is actually the closest match to the national pattern. Their income is triple that of the under $30K group. However, they still spend more than they make. This ends when incomes reach $50>$70K. For Pet Food Spending in 2017, the key was reaching $40+K in income. The $40>70K group spent $2.1B more on Pet Food, 45% of the national increase.
- $70K>$99K: In 2017 (14.9% of H/H’s) – $312.95 per H/H – $5.97B – Up $0.99B (+19.8%). The Pet Food Spending for this group has been very stable and in 2016 was even contrary to the national trend. They were the only group to increase spending on Pet Food in 2016. This middle income group is still value conscious. In 2017, it appears that the ongoing price war finally reached the “right” retail and they got fully “on board” with the Pet Food upgrade.
- $100K>$149K: In 2017 (12.7% of H/H’s) – $353.24 per H/H – $5.98B – Up $1.59B (+36.2%) They have a high income but also large families, with the resulting responsibilities. They look for deals too. Except for the dip in 2014, their spending matches the national pattern. In 2017, they had the largest increase in Pet Food spending. It appears that in today’s competitive market the pet food upgrade trend has reached a high level of penetration with this group.
- $150K> (10.9% of H/H’s) – $329.02 per H/H – $4.66B – Up $0.16B (+3.4%). 92% are college grads so they certainly know how to recognize value and how to save. Despite the higher price, they saw the value of Super Premium food very early in the cycle. In 2017, the $150>$200K part of the group finally focused on price. They reduced their H/H pet food spending by 27%. The increased $ in this group comes from the $200+K section and an increase in H/H’s.
In 2017, the increase in Pet Food spending was widespread across incomes. In fact, groups totaling 84.7% of all U.S. households spent more on Pet Food. However, there were 2 groups, $30>$40K and $150>200K, who spent less. These groups are far apart in income, but they both bought into the super-premium upgrade in 2015. It appears that the intensively price competitive market finally motivated both to “get a deal”. In terms of the income demographic, the food upgrade has made a deep penetration of the market.
Now let’s take a look at another Key Demographic Category – Age
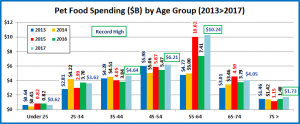
Again, the 2017 National Numbers were – $31.11B; Up – $4.61B (+17.4%); 2013>2017 – Up $8.15B (+35.5%)
For this demographic, 2017 Pet Food Spending was simple. Over 35, spending was up. Under 35, spending was down.
- 55>64 (19.0% of H/H’s) – $413.26 per H/H – $10.24B – Up $2.83B (+38.2%). This group (all Baby Boomers) has been the key to recent major spending swings. In 2015, a large portion of them changed their Pet Food spending behavior and opted to upgrade to Super Premium. In 2016 this group looked for and found a better price. In 2017 they are back again. However, rather than a whole new trend, the huge lift seems more likely to be the result of a deeper penetration of the upgrade movement in this age group as a result of increased availability and better prices.
- 65>74 (14.3% of H/H’s) – $217.84 per H/H – $4.05B – Up $0.26B (+7.0%). Much of this group is retired, with lower income, so price is always a concern. However the number of Baby Boomers in this group is growing, now 70%, so their spending pattern resembles that of 55>64 year olds. They also have a strong commitment to their pets which is evidenced by the fact that 1.1% of their Total H/H spending is on their pets.
- 75> (10.2% of H/H’s) – $134.47 per H/H – $1.73B – Up $0.25B (+16.8%). Both the effort and the expense of Pet Parenting become issues as we reach 75+. However, it appears that the discounted prices in 2016 and 2017 moved an increasing number of this group to upgrade their pet food.
- 45>54 (18.1% of H/H’s) – $265.27 per H/H – $6.21B – Up $0.74B (+13.6%) This group is #1 in income and total H/H expenditures. Up until 2015 they were #1 in Pet Food spending. They buy premium food but didn’t fully participate in the 2015 upgrade. They did take advantage of the 2016 discounts and spent less. In 2017, it appears that they became more committed to super premium as their Pet Food Spending reached a record high.
- 35<44 (16.2% of H/H’s) – $222.95 per H/H – $4.64B – Up $0.8B (+20.9%) They are 2nd in income and expenditures, but have the biggest families. Searching for Value is a way of life and their spending pattern tends to be less volatile. Apparently they found value in the 2017 prices as they spent 20.9% more and also set a new record.
- <25 (5.8% of H/H’s) – $80.11 per H/H – $0.62B – Down -$0.2B (-23.9%) This group has a very small share of pet food spending (2.0%) as they are just getting started as Pet Parents. Their Pet Food spending was flat in 2015>2016. In the past it has been prone to big swings, which was the case again in 2017, as it dropped -23.9%.
- 25>34 (16.4% of H/H’s) – $167.65 per H/H – $3.62B – Down -$0.08B (-2.2%) Their spending was down slightly in 2017 while all the older groups were up. I saved this group of older Millennials for last for a specific reason. They have a unique spending pattern, which is interesting and could be important. Let’s review the time since 2013:
- Their spending was up sharply in 2014 while other groups were showing only small increases or even declining numbers.
- In 2015, the movement to Super Premium caused a big spending lift for every group under 75 except the 25>34 group, which fell -29%.
- In 2016, every other group under 75 was “value shopping” so their spending fell sharply. However, the 25>34 year olds spent 23.7% more.
- In 2017, the spending of every group 35 and over increased as the food upgrade penetrated the market more deeply. For the 25>34 group, spending was down slightly, but essentially flat.
- Is it possible that the spending behavior of the 25>34 group provides a preview of next year’s national trend? Let’s hope not. If it does, then food spending in 2018 will be down, flat or at best have a minimal increase.
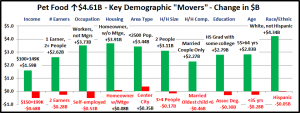
Finally, let’s take a look at other key demographic “movers” behind the $4.6B increase. Some are quite surprising.
Summary
The current “deflated”, price competitive market had a big impact on 2017 Pet Food spending. Super Premium foods have made sense from the beginning. The 25>34 yr old age group first bought into this in the second half of 2014. In 2015, many others followed their lead, especially the 55>64 yr old Boomers. Most of the initial upgrade group had a college degree, worked as a manager or professional and made a lot of money. There were some exceptions, like the first wave of retirees to convert. Then in 2016 the market changed, it became more price competitive and the internet came strongly into play. Many of the 2015 upgraders value shopped the category to a $3.4B dollar decrease. However, the price war didn’t end there. In 2017, it actually intensified with more competition, record deflation and increased availability of super premium foods.
The net result of this was very positive, with increased penetration of Super Premium foods across a wide range of demographics. In fact, of 94 demographic segments 78 (83%) had increased Pet Food spending, including 6 of 8 income groups and all age groups over 35. The wide range of the trend is also shown in where and how people live. Both renters and homeowners – with and without a mortgage had increases as did every area type, from rural to center city.
You see additional very specific evidence of the deep penetration of the upgrade in the winners listed in the chart above.
- Education: HS Grad w/some college
- Occupation: Workers, not Mgrs.
- Area: Under 2500 population
- # Earners: 1 Earner, 2+ people
2017 was a great year for pet food spending – up $4.61B due to increased “upgrade” penetration. What’s next? I don’t know that we can use the performance of the 25>34 year olds to predict 2018. I think we have to just wait and see.


