SUPERZOO 2018 – It’s a great Opportunity and a Sure Winner!

SuperZoo 2018 is only a month away. It is most definitely a great “Opportunity” for attendees and exhibitors and the “surest bet” in Vegas. Like Global Pet Expo, SuperZoo is a “must do” if you want to be a player in the U.S. Pet Market.

There are differences between the two shows. After all, GPE started the U.S. Pet Industry with the first trade show 60 years ago. It is still the largest annual show and has a huge international following with over 200 exhibitors from outside the U.S. On the other hand, SuperZoo traces its roots to a regional trade show for independent pet shops. It too has come a long way since those early days. Although Independents are still a major focus of the show, it has expanded both in size and its reach. With nearly 1200 exhibitors, a special section devoted to the fast growing grooming segment and over 100 international exhibitors, it too has become a “destination” for manufacturers, distributors and key players from all retail channels.

SuperZoo’s growth has not come without challenges. The latest started last year. In an effort to increase their impact on attendees, Exhibitors increased their booth size by 20%. Although the staff was able to acquire more floor space, it was not enough, so the exhibitor count was reduced by over 100. With another large trade group competing for space in the same time frame at the convention center, there was only one logical choice – move to a different date. Because of the impending Holiday season, a later date was not an option so they chose late June, 3 months after GPE.  This caused a little “hand wringing” by some exhibitors and a few decided to pass. However, these were rare exceptions, not the rule. The exhibitor count is again approaching 1200, but with the larger booth size. Exhibitors will occupy 285,000 square feet, up 23,000 sq ft (9%) from 2017. Plus, there is also room for a 23,000 sq ft New Product Showcase and over 7,000 sq ft for new sections showcasing Tech Advancements and Made in the USA products – two “hot” societal trends. Let’s take a closer look. We’ll start with some overview trends then move to the special floor sections.

  • Assigned Exhibitors: 1182; Up 95 (8.7%) from 2017
  • Booth Sq Ft: 285,000; Up 23,000 (8.8%) from 2017
  • 322 SZ 2017 Exhibitors (29.6%) aren’t at SZ 2018
  • 426 (36%) are new. They didn’t do SZ 2017
  • 511 (43%) SZ 2018 Exhibitors weren’t at GPE 2018
  • 307 (26%) are really new – Not at SZ 17 or GPE 18

  • You first notice that the count in Special Floor sections fell 6.6% while the overall exhibitor count increased by 8.7%. Smaller booths drove the increase. 97 more booths were 200 sq ft or less. 76 of these were 10×10 or smaller.
  • Since I began tracking SuperZoo in 2014, special sections have accounted for nearly 50% of exhibitors, peaking at 52% in 2016. This year’s 38% is even 6 percentage points below last year, when the show ran out of floor space.
  • Every special section but 1st timers has fewer exhibitors than last year. However, remember that over 400 companies weren’t at SuperZoo 2017 so the 74 doesn’t reflect the true count of new exhibitors.
  • The Natural Section is still large as this trend continues to be strong in the marketplace. The Grooming segment also continues to be important as this segment is growing and becoming even more competitive.
  • Rodeo drive is down 35% from its peak in 2016, perhaps reflecting the increased emphasis on function over fashion.
  • Ultimately, the show sets the size of the sections based upon exhibitor feedback. However, we may be reaching a point where exhibitors are less likely to embrace a limited categorization of their appeal.

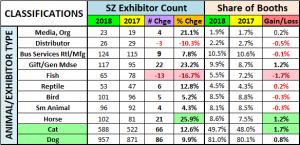
Now let’s look at the Exhibitors by type, including animal.

  • Almost all segments gained exhibitors but remember, to maintain your share you need an increase of at least 8.7%.
  • The most significant decline is in Fish – down to a 5.5% share. This is even more significant when you consider that in 2015 the share of exhibitors offering fish or aquatic products was 8.6%. That’s a 36.0% drop in only 3 years.
  • There was a big lift in Equine products which was driven by a big increase in the number of Horse Supplements.
  • Gifts/Gen Mdse/Uncategorized had a strong increase but is still down from their peak of 139 exhibitors in 2016.
  • We also need to take note of Business Services – up 9 (7.8%) from 2017, but up 79 (+176%) from 2014.
  • As always, Dogs and Cats are the royalty but the Cat share of exhibitors has grown from 44% in 2014.

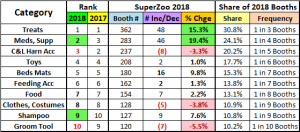
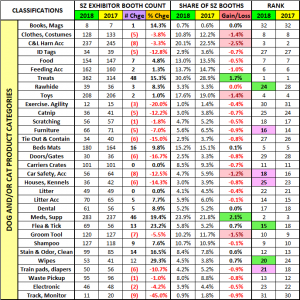
Let’s take a closer look at the “royalty”. Here are the top 10 Dog and/or Cat Categories at SuperZoo 2018.

  • You can see that it’s not all “rosy”. Three categories actually have fewer exhibitors and only three kept pace or exceeded the 8.7% increase in exhibitors. The 2018 Top 10 is the same as 2017 but two gained in rank and 2 fell.
  • The drops in Collars & Leads and Clothes are perhaps understandable as the industry moves more towards function. However, the decrease in Grooming Tools in conjunction with the increase in shampoos is a bit of a puzzle. Both categories are still strongly represented and this may be the result of competitive pressure in the grooming area.
  • Toys are losing share but surprisingly beds are gaining ground and floor space.
  • The big news is the seemingly unstoppable momentum of Treats and Meds & Supplements. In many cases their success is tied together as Supplements are often produced in Treat form. They now rank #1 & #2 in terms of exhibitor count, which is up 57% for Treats and 73% for Meds & Supplements from 2014. Amazing!

SuperZoo is growing in exhibitors and size. There are products and services available to fill virtually every need or want of the attendees. It is also staying in tune with what is happening in the overall consumer market which is illustrated by the new Tech and Made in the USA product showcases. 994 exhibitors (84%) focus on Dog/Cat. Let’s take a closer look.

There are 95 more Exhibitors at SuperZoo. Those offering Dog and/or Cat products increased by 86. However, the increase is not “across the board”.

  • 16 of 32 (50%) Dog/Cat categories have fewer exhibitors in 2018 than in 2017
  • Only 8 of 32 (25%) of the categories increased their share of exhibitor booths

In the Top 10 categories we saw losses by Apparel and Collars & Leads but huge gains in Treats and Medication/Supplements. There are only a few other significant gains in the other Dog/Cat categories:

  • Wipes: +12 (29.3%)
  • Flea & Tick: +13 (23.2%)
  • Stain/Odor/Clean Up: +14 (16.5%)

When you look at the 5 Dog/Cat Categories making big gains, you can see a common thread – the health and wellness of our companion animals. This fits right in with the ongoing trend in Pet Food to more nutritionally focused recipes.

SuperZoo certainly showcases what is “happening” in the Pet Industry and offers a great opportunity for attendees and exhibitors to make a mutually beneficial connection. Once again, it’s the surest bet in Las Vegas!

Finally, the chart below details the specifics for all 32 of the Dog/Cat product categories that I defined for the Super Search Exhibitor Visit Planner.  (Note: The SZ 2018 Super Search will be released on June 5th.)

TAKE A LOOK. I HOPE TO SEE YOU IN VEGAS!


U.S. PET SUPPLIES SPENDING $17.43B (↑$2.59B): MID-YR 2017 UPDATE

In our mid-year analysis of Pet Food spending, we saw a slightly negative number but discovered that this was primarily due to a carryover from the second half of 2016 and was masking a very positive start for 2017. Pet Supplies spending tells a totally different story, and it is all positive. Mid-Year 2017 Pet Supplies spending was $17.43B, up an incredible $2.6B. Pet Supplies Spending last reached this level in Mid-Year 2013 and is higher than any annual number since 2010. The following chart should put the recent spending history into perspective.

Here are this year’s specifics:

  • Mid Yr 2017 ($17.43B) vs Mid Yr 2016 ($14.84B)
    • ↑ $2.59B (+17.5%)
      • Jul > Dec 2016: ↑$1.0B
      • Jan > Jun 2017: ↑$1.6B

Like Pet Food, Pet Supplies spending is also on a roller coaster ride. However, the driving force is much different. Pet Food is “need” spending and is powered by a succession of “must have” trends. Pet Supplies spending is largely discretionary so it is impacted by 2 primary factors. The first is spending in other major segments. When consumers ramp up their spending in Pet Food, like upgrading to Super Premium, they cut back on Supplies. However, it can go both ways. When they value shop for Premium Pet Food, they take some of the saved money and spend it on Supplies. The other factor is price. Price inflation tends to retard sales, usually by reducing the frequency of purchase. On the other hand, price deflation generally drives Supplies spending up. There is also another factor that can “trump” both of these influencers – innovation. If a new “must have” product is created, something that significantly improves the pet parenting experience, then consumers will spend their money. Unfortunately, we haven’t seen much of that in this segment recently.

In 2015, consumers spent $5.4B more on Pet Food. At the same time, Pet Supplies prices went up 0.5%. This was a “killer” combination as Supplies spending fell $2.1B. In 2016 consumers value shopped for Food, saving $2.99B. Supplies spending stabilized by mid-year then increased by $1B in the second half, despite price inflation of 0.6%. Consumers spent some of their “saved” money on Supplies. In December 2016 Supplies Prices turned downward and stayed below 2016 levels all year. Food spending increased $1.94B in the first half of 2017 but this came from a limited group. The result was that Supplies Spending had explosive growth, up $1.6B. Let’s look a look a little deeper at the “who” behind the big Supplies Spending increase.

First, 2017 Mid-year Supplies Spending versus previous year by Income Group

  • The Supplies spending was flat in the financially pressured <$30K group. Everyone else had an increase.
  • With the exception of the lower middle income $50>$70K group, all of the increases exceeded $0.5B.
  • The increases grew larger for groups with income over $100K. This is to be expected in discretionary spending.

Now, let’s take a look at another key demographic – Spending by Age Group

  • Once again, the increase is very consistent across age groups, with the exception of the 25>34 year old Millennials.
  • Although the spending fell in the 25>34 group, we should remember that last year they were the only group from 25>75 to have an increase in Supplies Spending. On average their Supplies Spending has been consistent over 3 yrs.
  • The biggest $ increase (+$.73B) came from the 35>44 group. (Gen Xers…again). The biggest % (+48%) came from 75>

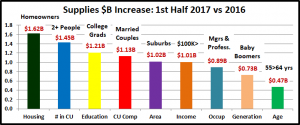
The Supplies Spending increase is remarkably well spread across both income and age groups. Mid-year sales numbers include data from parts of two calendar years. One of the priorities of this analysis is to determine how the latest year is starting out. Supplies’ Spending in the first half of 2017 was up $1.6B versus the same period in 2016. Our final chart will show the segments driving that big increase in key demographic categories.

You can see that there were very strong increases across the whole spectrum of demographic categories. In fact, only 6 of 80 separate demographic segments had a decrease in Supplies spending in the first half of 2017 and those were all minor. The leaders in our chart may all seem very familiar. They should be familiar. They are the traditional leaders in Pet Spending. The fact that they are leading the surge in 2017 Pet Supplies Spending may indicate that this segment is finally “returning to normal”. We’ll see what the second half of 2017 brings, but this is a great start


U.S. PET FOOD SPENDING $28.44B (↓$0.18B): MID-YEAR 2017 UPDATE

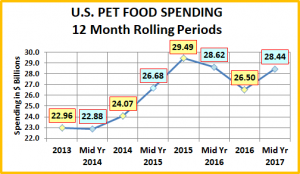
The US BLS just released their Mid-Year Update of the Consumer Expenditure Survey covering the period 7/1/2016 to 6/30/2017. The report shows Pet Food Annual Spending at $28.44B (Food & Treats). The following charts and observations were prepared from calculations based upon data from that report and earlier ones. The first chart will help put the $28.44B into perspective with recent history.

Here are the current numbers:

  • Mid 2017: $28.44B; ↓$0.18B (-0.6%) from 2016

The net $0.18B in Mid 2017 came from:

  • Jul>Dec 2016: Down $2.12B from 2015.
  • Jan>Jun 2017: Up $1.94B from 2016

Spending turned sharply upward in the first half of 2017. This probably should have been expected. We have noted in previous reports that Pet Food spending has been on a roller coaster since 2000, with 2 years up, followed by a flat or even declining year. This chart perfectly reflects this pattern. This up and down “ride” has been driven by a succession of Food trends. 2013 was a down year. It was followed by 2 up years as an increasing number of consumers opted to upgrade to Super Premium Foods. Spending peaked in 2015 then fell sharply as consumers began value shopping for food, at retail outlets and on the internet. With the big lift in the first half of 2017, it looks like we’re right “on track” for a spending increase in 2017. In fact, in the second half of 2017, if we recover only half of the $2.12B drop that we had in the second half of 2016, 2017 will set a new record high for pet food spending.

There is another factor at work in the market. From 2014 to 2017, the Pet Food segment experienced a period of record deflation. Normally, in a need based category, this would drive spending down. That has not been the case. In fact prices edged up 0.2% in 2016 when sales were plummeting. What it does indicate is that we are in an incredibly competitive market. This is great for today’s value driven shoppers but it is tough on manufacturers, distributors and retailers.

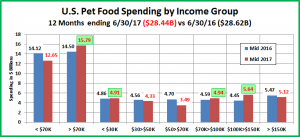
Now, let’s see where the $26.44B came from – First by Income Group (Increases highlighted in green)

  • When you look at the over/under $70K groups it looks normal. Higher incomes: ↑$1.29B; Lower incomes: ↓$1.47B.
  • However, increases are not directly tied to income. The upper middle class bought more. The big earners spent less.
  • The <$30K group also had a small increase. This group is made up of those just getting started and older Americans.

That brings up a good question. Let’s look at Pet Food Spending by Age Group. (Increases highlighted in green.)

  • This demographic measure certainly tells a different story than household income. All but 2 groups are up.
  • The <25 group is down slightly so that probably answers our income question. Older, low income H/H’s spent more.
  • The 55>64 yr olds are dragging down the entire food segment. They had the biggest increase in 2015 but they also had a huge spending drop in the second half of 2016. That is reflected in these numbers.
  • Besides the widespread increase there is also some other “hidden” good news. The 35>54 age group led the way with a $2B increase. Why lump them together? Because 80% of them are Gen Xers. In this case, they are the heroes.

One of the primary purposes of the Mid Yr Update is to see how the latest year is starting. Considering the differences between the income and age reports, it makes sense to compare the most recent Jul>Dec and Jan>Jun numbers to the previous period. Spending is flat but seems to be turning up in 2017. These charts will show us when the change started.

  • In terms of Income groups, virtually everyone had a bad second half of 2016. The 2017 “bounce back” is coming from 2 sources – the over $100K and the under $50K groups. The $50>$100K middleclass is left out – so far.
  • The $70>$100K group started out 2017 “flat” but they were the only group with a positive 2016 second half. Hmm?
  • In terms of age groups, the second half of 2016 was basically neutral, with the exception of the big drop by 55>64.
  • In regard to our earlier “Hmm” remark, look at the 25>34 group. Their spending pattern correlates with the $70>$100K income group. In fact these 2 groups were the only ones to significantly increase food spending in their categories in 2016. Perhaps, the Millennials started a trend in 2016 that was picked up on by “others” in 2017.
  • The “others” that radically increased Food spending in the first half of 2017 were Gen Xers and the oldest Boomers.

If the newest trend is focused on high nutrition, with clean labels and transparency, it may have “struck a chord” with Gen Xers. Here are some more demographic segments with a strong start to 2017, which support the assertions above.

  • Homeowners, No Mtge: +$1.23B
  • Suburban: +$1.15B
  • College Grads: +$1.13B
  • Mgrs & Professionals: +$.92B
  • 2+ Singles H/H’s: +$.84B
  • 1 Person H/H’s: +$.75B
  • 5+ Person H/H’s: +$.72B
  • Center City: +$.50B
  • Retired: +$.44

These groups suggest that the new trend could have an even broader appeal. We’ll see what happens in the second half.