Pet Products spending totaled $43.46B for the 12 month period ending 6/30/16. This was an increase of $0.93B (+2.2%). Total U.S. spending for the period totaled $7.26 Trillion, up $230B (+3.3%). For this 12 month period, Pet Products are not quite keeping up the pace. However, they still account for almost 2/3rds of all Pet Spending and 0.6% of Total U.S. consumer spending – not insignificant numbers.
In this report we will update Pet Products Spending for perhaps today’s most popular demographic measurement – by Generation. Are the Baby Boomers still spending like they used to? What about Gen X? They are next in line. And the Millennials, the hope for the future, are they making progress to eventually lead the way? The numbers come from or are calculated from Data in the US BLS Consumer Expenditure Survey.
First let’s define each generation and look at their share of U.S. Financially Independent Consumer Units (H/H’s)
Generations Defined
Millennials: Born 1981 and after: In 2016, age 18 to 35
Gen X: Born 1965 to 1980: In 2016, age 36 to 51
Baby Boomers: Born 1946 to 1964: In 2016, age 52 to 70
Silent Generation: Born 1929 to 1945: In 2016, age 71 to 87
Greatest Generation: Born before 1929: In 2016, age 88 and over
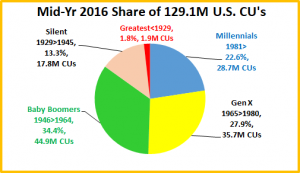
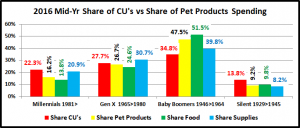
- In terms of Financially Independent Consumer Units, Boomers are still the largest group with 44M (34.4%)
- The two oldest generations are significantly losing numbers, primarily due to death and movement to assisted living facilities. The Greatest Generation will soon be too small to be a viable, measureable separate spending group.
- Gen X, while it gets little publicity, is currently the second largest CU group, balanced between the Boomers and Millennials, who both have more total members.
- Millennials now are the largest generation in sheer numbers, but are developing financial independence more slowly than past generations. Ultimately, they will “grow up”, which will move them into the #1 spot in CU’s. They will also get the biggest lift from immigration. As their marriage rate increases, the CU count will fall slightly.
There is the obvious difference in age to be considered and differences in behavior. However, we have also learned that there are key Consumer Unit characteristics, like income, family situation and home ownership that make a difference in Pet Spending. Let’s look at some of these key differences.

- It just takes 2. Households with 2 or more people account for 81.5% of all Pet Products Spending
- The size of the CU and number of children is all about Family responsibility and all the financial pressures that this generates. As you can see, it is beginning to slowly ramp up with the Millennials but is at its peak with the 36 to 51 year old Gen Xers.
- Married couples with children (especially over 6 yrs old) have always been an important segment in Pet Products spending, especially for Supplies.
- However, the recent move to upgrade to Super Premium Food by the Boomers has changed the dynamics of this somewhat and brought Food even more strongly to the forefront of Products Spending.
- Boomers still average 2+ people in the CU. However, they are much less likely to have children <18 at home. As their human children leave home, they turn their attention and spending to their Pet Children who are still with them.
- Pet Products spending is also tied to the number of earners in a CU. 2 Earner CUs annually spend 38% more on Pet Products than 1 Earner CUs. As you can see the “earning” is being done in America by Gen Xers, Millennials and Boomers with Gen Xers at the top, as to be expected.
- Homeownership – Owning and controlling your own space has always been a key to increased Pet Ownership and spending. Homeowners currently account for 79.3% of all Pet Products Spending. In fact, the Pet Products Spending by Homeowners with mortgages is up $1.2B through 6/30/16.
- The Gen Xers have reached the national average and homeownership continues to increase until we reach the oldest Americans – 88+ years old.
- The Millennials are obviously lagging behind. The first big lift in Homeownership occurs from age 25>34. Right now 39% of these older Millennials own a home. When Gen Xers and Boomers were the same age 48% of them owned homes – over 20% more.
Next we’ll compare the Generations to the National Avg. :
In Income, Spending, Pet Products Spending and Pet Products Share of Total $pending
CU National Avg: Income – $72,990; Total Spending – $56,258; Pet Products Spending – $336.98; Pet Share – 0.60%

- Income – The 35>51 year old Gen Xers lead the way. The Boomers earn about 15% less and their income will continue to fall as they age. The big drop occurs with the Silents as retirement becomes almost universal. The Millennials income is over 20% less than the Boomers and only about 2/3rds of the Gen Xers.
- Total Spending – The Gen Xers make the most and spend the most but it’s not out of line with their income. Boomers also spend more than the average but once again their income can support it. Spending doesn’t fall as fast as income with the older generations. In fact, they are actually deficit spending in relation to their after tax The Millennials under 25 are also in an after tax income deficit spending situation. However, the rising income from the 25>35 group makes up the difference and brings overall generational spending in line with income.
- Avg CU Pet Products Spending – The Gen Xers spend 33% more than the Millennials but still slightly less than the National Average (97%). The Boomers spend 42% more than Gen X and is the only group spending above the National Avg. on Pet Products. However, it hasn’t always been this way. In 2014 Gen X and Boomers spent exactly the same amount annually on Pet Products (within 1 cent) which was 113% of the National Average. The Boomers’ upgrade to Super Premium resulted in a huge increase in the national average and left the Boomers alone at the top.
- Pet Products Share of Total Spending – One measure of the level of commitment to their Pets.
- Only Boomers exceed the National Average but The Silent Generation comes in 2nd, demonstrating a lifetime commitment to their Pets. It also should be noted that these older generations have a much stronger commitment to higher quality, higher priced Foods.
- Gen Xers overall make and spend the most money. They are also second in actual Pet Products Spending. Two things stand out – they are probably not opting for Super Premium Foods and Supplies are much more important to them than to the older generations.
- Millennials are in third place but their percentage is a definite indication of commitment to their Pets. They are definitely value shopping for Foods but Supplies are extremely important to this group with Spending nearly matching Food.
- The Greatest Generation at 87+ is still hanging on and you can see that the necessity of Food is of primary importance in their Pet Products Spending behavior.
- It’s time to look at actual $ Spent by Generation on Total Pet Products as well as Food and Supplies in terms of share of sales as well as the Mid-Year 2016 performance compared to the previous year starting with Total Pet Products…

- Regarding share, Boomers continue to dominate largely due to their Food upgrade in 2015. Not only do they have the biggest piece of the Pet Products “pie” (47.5%), it is 11% larger than #2, Gen X and #3, Millennials combined.
- The Greatest Generation is a welcome part of the industry but at 0.4% share they are no longer a factor.
- In terms of 2016 Mid-Yr Performance, it was all Boomers. They were up $2.02B in Pet Products spending. Every other generation spent less…a total of $1.1B less. Let’s get specific.
- Boomers – Ave CU spent $464.15 (+$43.56); 2016 Mid-Yr Pet Products spending = $20.63B, Up $2.02B (+10.9%)
- The increase came entirely from the 1st 6 months. Ave CU spent $327.34 (-$12.09); 2016 Mid-Yr Pet Products Spending = $11.59B, Down $0.26B (-2.2%)ths. – Jul>Dec 15, Up $2.9B; Jan>Jun 16, Down $0.88B.
- Gen X – Ave CU spent $327.34 (-$12.09); 2016 Mid-Yr Pet Products Spending = $11.59B, Down $0.26B (-2.2%)
- Almost all of the decrease came in 2016. – Jul>Dec 15, Down $0.02B; Jan>Jun 16, Down $0.24B
- Millennials – Ave CU spent $247.02 (-$14.41); 2016 Mid-Yr Pet Products Spending = $7.04B, Down $0.34B (-4.6%)
- Sales bounced back in 2016. – Jul>Dec 15, Down $0.52B; Jan>Jun 16, Up $0.18B.
- Silent Gen. – Ave CU spent $228.12 (-$27.85); 2016 Mid-Yr Pet Products Spending = $4.02B, Down $0.44B (-9.9%)
- All of the drop came in 1st 6 months. Jul>Dec 15, Down -$0.48B; Jan>Jun 16, Up $0.04B – a slight increase.
- Greatest Gen.– Ave CU spent $90.86 (-$5.47); 2016 Mid-Yr Pet Products Spending= $0.17B, Down $0.06B (-26.1%)
The Total Spending increase was all due to Boomers. Now let’s look at individual segments. First, Pet Food..

- Since their 2015 Upgrade, Boomers continue to spend more on Food/Treats than all other Generations combined.
- Gen X has 24% more CU’s than the Millennials but spent 78% more on Pet Food.
- Millennials spent $0.59B less on Food Mid-Yr 2016 versus the previous 12 months.
- Boomers – Ave CU spent $332.75 (+$59.36); 2016 Mid-Yr Food spending= $14.73B, Up $2.66B (+22.0%)
- July>Dec 15 (+$3.5B) – Reflects Food Upgrade; Jan>Jun 2016 (-$0.84B) – Looks like they pulled back a bit.
- Gen X – Ave CU spent $199.66 (+3.65); 2016 Mid-Yr Food spending= $7.03B, Up $0.21B (+3.1%)
- The lift came entirely in Jul>Dec 15 ( +0.44B); In Jan>Jun 16 they gave half of the Fall increase back (-0.23B)
- Silent Generation – Ave CU spent $159.46 (-$19.94); 2016 Mid-Yr Food spending $2.8B, Down $0.32B (-10.3%)
- Spending fell in both halves. Jul>Dec 15 (-0.21B); Jan>Jun 16 (-0.11B)
- Millennials – Ave CU spent $138.90 (-$21.87); 2016 Mid-Yr Food Spending $3.94B, Down $0.59B (-13.0%)
- Age 25>34 upgraded Food in late 2014, then pulled back in 2015. Dec 15 (-0.89B); However, they showed some resiliency as they bounced back in Jan>Jun 16 (+$0.3B)
- Greatest Gen. – Ave CU spent $63.73 (+$4.63); 2016 Mid-Yr Food spending= $0.12B, ↓ $0.02B (-14.3%)(less CUs)
We are still seeing the residual effect of the Boomers 2015 Upgrade. 2016 is not starting off well as there is some pull back on the upgrade and only Millennials are showing plus numbers for the 1st half. Now on to the Supplies Segment.

- Boomers still have the largest share but unlike Food, the Younger Groups – Gen X and Millennials control 51.6%.
- Millennials – Ave CU spent $108.12 (+$7.46); 2016 Mid-Yr Supplies spending= $3.11B, Up $0.26B (+9.1%)
- FINALLY, a bright spot for Supplies. Jul>Dec 15 (+$0.38B); Jan>Jun 16 (-$0.12B) But it faded a bit in 2016.
- Baby Boomers – Ave CU spent $131.40 (-$15.80); 2016 Mid-Yr Supplies spending= $5.90B, Down $0.64B (-9.8%)
- In 2016 the Spending decline basically stops. Spending Jul>Dec 15 (-$0.6B); Jan>Jun 16 (-$0.04B)
- Gen X – Ave CU spent $127.68 (-$15.74); 2016 Mid-Yr Supplies spending= $4.56B, Down $0.47B (-9.3%)
- The same story as the Boomers. Spending decline turns flat in 2016. Jul>Dec 2015 (-$0.43B); Jan>Jun 16 (-$0.01B)
- Silent Generation – Ave CU spent $68.66 (-$7.90); 2016 Mid-Yr Supplies spending= $1.22B, Down $0.12B (-9.0%)
- Spending in the 1st half of 2016 actually increased. (+$0.15B). However, not enough as Jul>Dec 15 was (-$0.27B)
- Greatest Gen. – Ave CU spent $27.13 (-$10.11); 2016 Mid-Yr Supplies spending= $0.05B, Down $0.04B (-44.4%)
It appears that the steep drop in spending during 2015 could be coming to an end. Sales in the first 6 months of 2016 were down only $0.06B and essentially were flat versus the same period in 2015. Boomers and Gen X, which account for 70.5% of all Supplies Spending, both mirrored this trend. We’ll see what the 2nd half of 2016 brings.
In the final chart we will look at the spending performance of each generation. We will compare their share of spending on Total Products, Pet Food and Pet Supplies to their share of CU’s and see “Who is earning their share?”
Performance = Share of Spending/Share of CU’s; 100+% indicates you are “earning your share”
- Silent Generation Performance – Pet Products: 66.7%; Pet Food: 71.0%; Pet Supplies: 59.4%
- This group ranges in age from 71 to 87. Pet ownership is more difficult after age 75 and this is reflected in the low share of Pet Products spending. However, the desire and the commitment is still there. This is evident in the 71% performance on Pet Food. While they don’t “earn their share”, their performance is better than the Millennials.
- Baby Boomers Performance – Pet Products: 136.5%; Pet Food: 148.0%; Pet Supplies: 114.4%
- The Boomers led the way in building the industry and they are still doing it. They are earning their share and in fact, the spending leader in both Food and Supplies. Ultimately, this will fade as they age but based upon their history, they will continue to perform for many more years, well into old age.
- Gen X Performance – Pet Products: 96.4%; Pet Food: 88.8%; Pet Supplies: 110.8%
- Next in line and next in performance to the Boomers, the Gen Xers are the only other generation to “earn their share” in spending on a Pet Product segment – Supplies. Spending on Supplies is a much higher priority for the younger groups. Gen Xers range in age from 36 to 51. As they reach the 50 to 54 age group, their children will start to move away from home and their focus will turn to their Pet Children. Expect their performance to surpass the 100% level within the next 5 years as they move to take over the #1 spot from the Boomers.
- Millennials Performance – Pet Products: 72.6%; Pet Food: 61.9%; Pet Supplies: 93.7%
- The Millennials are widely touted as the future of the industry. This is ultimately true, but the future is still a ways off. The Millennials are currently 18 to 35 years old. They have pets, a lot of them, but their responsibilities are growing and money is still in short supply. They spend a lot on Supplies as they are establishing Pet households and actively seek products that make Pet Parenting easier. However, value shopping is still the rule. They initially bought into the food upgrade in 2014 but pulled back in 2015. They are 20 years away from occupying the highest income group. Also, since they are having children later, the spending lift from children leaving will undoubtedly be delayed. We’ll keep a close eye on them, but realistically, they are 20 years away from being the dominant force in Pet Spending.


