2015 Top 100 U.S. Retailers; $+4.9% 134,800 Stores with Pet Products…plus the internet!
The U.S. Retail market reached $5.3 Trillion in 2015 from all sources – Supercenters, Restaurants, Online retailers, even Pet Stores. This year’s increase of $118B was less than 2014’s $196B and was driven down by a 19% drop in total Gas Station revenue. (Data courtesy of the Census Bureau’s Monthly Retail Trade report)
In this post we will try to narrow the focus to the top 100 Retailers in the U.S. Market – the headliners. These 100 companies account for 38% of the total retail market! How did they perform in 2015 vs 2014…and of course, which ones sell Pet Products? Remember, according to the 2012 Economic Census, over 2/3 of the Pet Products in the U.S. are sold outside of Pet Stores. The Top 100 group accounts for a huge share of these sales. This report is crammed with data, but we’ll try to break it into smaller pieces with regular observations. All of the base data on the Top 100 comes from Kantar Research and was published by the National Retail Federation (NRF).
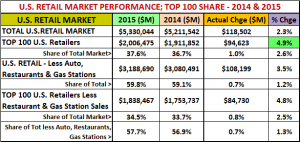
Let’s start with an overview:
Observations
- The Total Market grew $118.5B in 2014 – Up 2.3%
- The Top 100 grew $94.6B and the growth rate of 4.9% far exceeded the overall market.
- The Top 100 accounts for 37.6% of the total market.
- Let’s pare it down a bit. If you take out Auto, Restaurant and Gas Station sales, the “target” retail market for our industry is $3.2 Trillion. – about 60% of the total market.
- Removing the Restaurant & Gas Station sales from the Top 100 numbers – at $1.84T they are still 34.5% of the Total U.S. Market and…
- 57.8% of the $3.2 Trillion target market.
The Top 100 is obviously critically important, and as expected it’s outperforming the overall market. We need to remember that this “Top 100 club” is in fact a contest. Every year companies drop out and new ones replace them. This can be the result of mergers, acquisitions or simply slumping sales. Changes of note in 2015:
- 6 companies on the 2014 list were “combined” into 3 in 2015 – Albertsons + Safeway = Albertsons; Dollar Tree acquired Family Dollar Stores; Aldi & Trader Joe’s are now combined under Aldi.
- We also lost 2 old friends from the list – Dell sales continued to decline, but A&P shut down after 156 years.
- 3 Major Gas Stations made the list. Fuel sales are only counted in their numbers when they are less than 50% of Total Revenue. Obviously, the gas price drop had a far reaching impact.
Now let’s start “drilling down” on the Top 100. Here’s a summary of Regular and Online Retailers versus the bundled total for Restaurants & Gas Stations
Observations
- Biggest note may be that the Regular Retailers have 58% of the stores but account for 92% of the business.
- 90% of the $ growth is coming from Regular & Online Retailers, but their percentage growth is lagging behind restaurants at 6.4% (a big turnaround from 2014 when restaurants were only up 2%)
- +4.8% increase in $ales – $84.7B (Last year it was +$81.5B)
- +2.8% in stores – Slowed markedly from 2014 (+6.9%) but better performance in store.
Now that we have an overview of the Top 100, let’s take a look at the “targeted” retailer segment. There are 82 total companies. How many are buying and selling Pet Products? This will reinforce how Pets have become an integral part of the American Household and how fierce that the competition for the Pet Parents’ $ has become.
- Of 82 possible companies, 67 are selling some mixture of Pet Products in stores and/or online.
- Their Total Retail Sales of all products is $1.7 Trillion which is…
- 93% of the total business for Regular & Online Retailers in the Top 100
- 32% of the Entire $5.3 Trillion U.S. Retail market – from 67 Companies who are in tune with America and all sell pet products – amazing!
- 134,802 Stores (75%) are stocking and selling pet products on the retail shelf – 6300 more than 2014
- Online only is another Story –
- Amazon & QVC account for $13.9B of the $14.7B “online only” increase.
- Many Traditional Retailers who only sell Pet Products online are closing stores and losing ground in the total Retail “race”. Perhaps, they are slightly “out of tune” with America.
- Their Total Retail Sales of all products is $1.7 Trillion which is…
The Business for retailers selling pet products remains strong. We also should remember that these store count totals are only for the Top 100 and include only 1 Pet Chain and 1 Farm Store Chain, as they were the only companies to make the list. Pet Products are sold in thousands of other retail outlets – 20,000 more grocery stores, 10,000 more pet stores, 16,000 Vet Clinics plus…. A reasonable estimate would be 200,000 outlets selling pet products.
In the next segment we will look at the detailed list of the top 100. We’ll sort it by retail channel with subtotals in key columns. We’ll then break it into smaller sections for comments. At the end of the post there will be a download link for an Excel file with the data. This will allow you to sort it as you choose…by rank, alpha, pet/nonpet…it’s your call.
I have not done a lot of highlighting however:
- Pet Columns ’15 & ‘14 – a “1” with an orange highlight indicates that products are only sold online
- Rank Columns – Change in rank from 2014: (Remember 6 from 2014’s list were consolidated into 3 in 2015)
- Up 5-6 spots = Lt Blue; Up 7 or more = Dk Green
- Down 5-6 Spots = Yellow; Down 7 or more = Dk Pink
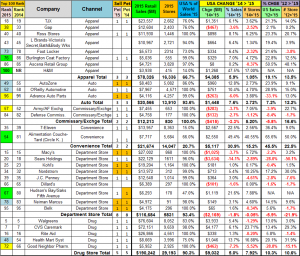
Let’s get started. Remember online sales are included in the sales of all companies.
Observations
- Drug is still strong. However, acquisitions are a big factor. Awaiting approval is a Walgreens and Rite Aid merger, which would create a $100B company and move Walgreens to #3 on the Top 100 list.
- The Traditional Department store segment overall continues its decline. There are a few exceptions in some “high end” stores. However for most, the trend is down.
- Sears (includes Kmart) and Macy’s are the 2 big “red flags” and more store closings are planned.
- Although many carry a few pet items, generally online, they have never embraced Pet – strange.
- Convenience is still a key “driver” for Americans so convenience stores are doing well. However, much of the growth in the Top 100 is coming from acquisitions.
- Military Commissary sales are falling despite additional locations.
- The Auto Parts Stores are a mixed bag, with all chains opening new stores. Only Advance is underperforming in sales. With the ever increasing focus on the Pet Travel product category, it is somewhat surprising that everyone’s offering of Pet items is so sparse – A possible opportunity?
- The Apparel retailers are showing surprising strength, especially from value outlets. The three chains that carry pet products are contributing more than half of both the total sales…and the total increase.
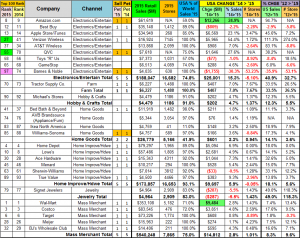
Observations
- Headline: Amazon sales are only up 94.7% in 3 years!
- The Phone People – especially Verizon and Apple, continue their extraordinary growth.
- QVC also made a big move – jumping up 15 places to #55 on the list.
- Barnes & Noble and Toys R Us continue to decline. Barnes & Noble may drop off the list in 2016.
- Signet Jewelry got on the list in 2014 by acquiring Zales. This year…sales are down 5.5%
- Mass Merchants’ growth percentage is subpar, but all companies are up and a $14.8B increase is impressive.
- Wal-Mart is the “big dog” and their 2.8% increase in 2015 is slightly above recent years. Sales in SuperCenters continue to grow but “regular” Discount Department Stores are losing market share. This impacts the overall business in both Wal-Mart and Target.
- Target sales are up – barely. Their annual growth rate since 2012 is only 0.6%.
- Clubs continue to have the highest growth rate. Both Costco and BJ’s are up 17% since 2012.
- This is a huge Market segment for Pet Products and we’re seeing growth from all the “players”.
- Home Improvement/Hardware is showing continued strong growth – especially Home Depot and Lowe’s.
- Home Goods sales growth slowed in 2015 but all companies had increases.
- Tractor Supply’s growth slowed in 2015, +7%, down from +12.7% in 2014. Annual growth rate is still 10.1%.
Observations
- Supermarkets – $376B in Sales; 18 Companies; Over 16,000 stores; All Selling Pet Products. This is another important group for the Pet Industry. With the highest frequency of consumer visits of any channel, the competition is fierce. We have seen a series of mergers and acquisitions as companies try to strengthen themselves for the daily battle. We saw A & P cease operations after 156 years in business. From 1915 to 1965 they were the largest retailer of any kind in the United States. In a changing environment, you must adapt to survive.
- Although the total increase is below average, all but one are showing increases. Last year, 5 were down.
- Mergers and the loss of A&P dropped the companies from 21 to 18, but store count is only down 280.
- Small Format Value Stores: Overall this segment does more business than Traditional Department Stores.
- Dollar Tree’s acquisition of Family Dollar Stores seems to be working.
- Dollar General is performing best, up 7.7% with an average annual increase rate of 8.3% since 2012.
- Only Big Lots performance is subpar. However, they are up slightly after 2 years of declining numbers.
- This segment is growing in numbers and popularity. They are committed to Pet Products and their focus on value appeals to today’s ever more price conscious consumers.
- PetSmart – Although PetSmart’s growth is only 3.2%, it is better than last year’s 2.4%
- Office Supply Stores – Mergers, store closings – a lot of turmoil. The increase is a bit of a surprise.
- Sporting Goods – Some turmoil in this category as Sports Authority faded in 2015. (Closing in 2016) However:
- Dick’s continued to expand both in store count and sales – up 6.5%
- Academy is a newcomer to the Top 100 list, entering strongly at #88, after a 16.9% sales increase.
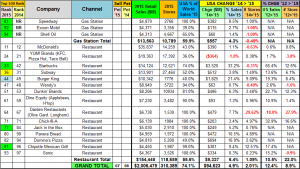
Restaurants & Gas Stations and the Grand Total
Restaurant & Gas Station Observations
Although restaurants & gas stations aren’t relevant in terms of Pet Products Sales, they are relevant in our daily lives. Most of these restaurants are fast food…plus coffee shops. Also, remember that when fuel sales at Gas Stations are more than 50% of the total, they are not counted in qualifying for a Top 100 sales
- Last year Restaurants had a 2% increase, pulling the Top 100 down. This year’s 6.4% is just the opposite.
- Kudos to Burger King for a big comeback after a bad 2014 and to Starbucks for continued strong growth
Wrapping it up!
Retailers earn their spot in the Top 100 by producing big numbers so it’s not surprising that their overall performance was strong, +4.9% compared to +2.3% for Total U.S. Retail.
Pet Products are an important part of the success of the Top 100. Sixty-seven companies on the list sell Pet Food and/or Supplies. Their Total sales exceed $1.7T in 134,800 stores and online. Obviously, this is a hugely important group to our industry whether you are a manufacturer trying to capitalize on their consumer appeal or a retailer trying to succeed in a very competitive marketplace. Do the math. If we take out PetSmart’s $6B and the remaining companies generate only 1% of their sales from Pet, we’re looking at $17B in Pet Products sales from only 66 sources…and 1% is low for this group.
The Top 100 is also evolving, just as we are seeing in the Pet Industry. Acquisitions, mergers, everyone is trying to find a formula for success in a highly competitive environment. To survive and prosper you must adapt.
We’ll wrap up this report with a few “Funtastic Facts” about the performance of the 2015 Top 100:
- The Top 10 Retailers accounted for 51% of all Top 100 Sales and 48% of the increase.
- The Top 10 Brick ‘n Mortar Retailers plus Amazon accounted for 20% of the sales of the ENTIRE U.S. RETAIL MARKET.
- The 5 Retailers with the biggest sales gains accounted for 33% of the net increase for TOTAL U.S. RETAIL.
Now, I suggest that you take a closer look at the Top 100 Excel file, find your own “funtastic facts” and see what is relevant to your business.
[button link=”https://petbusinessprofessor.com/wp-content/uploads/2016/08/Top100-US-Retlrs15-14-Ranked.xlsx” type=”icon” newwindow=”no”] Download 2015 Top 100 U.S. Retailers List(Excel)[/button]


