Pet Prices Update: September 2015 – Things are looking UP↑

All segments – even Food, saw price increases in September. Overall we are rebounding after the huge July drop in Food  & Supplies prices took the whole industry negative. October and November should be calm with moderate increases leading up to December. That is the big question remaining. Except for 2014, prices for Food and Supplies have fallen in December since the recession. We’ll see.

Why does all this pricing info matter? Pricing is intimately linked with Consumer Expenditures. In our recent Post on 2014 Pet Expenditures we saw how steadily rising prices on Food and Supplies in the second half of the year helped change 2014 from a good year to a great year for supplies…and turned a negative into a positive for Food. By the same token, rapidly rising Veterinary prices contributed to lower income households spending $1B less on Veterinary Services. However, it’s not just low prices. It’s value. You can charge more if it’s “worth it”…and you can prove it to the consumer, who now can compare products and prices instantly.

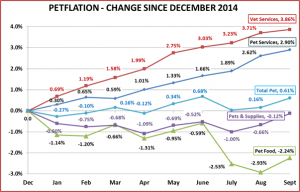
First, let’s take a look at what 2015 looks like so far…

CPI-9-15-1

SPECIFICS ON CPI CHANGES

Veterinary Services

  • Sept – Up ↑ 0.15% (Last year Sept went Up ↑ 0.19% – about the same)
  • Year To Date: Up ↑3.71%

NonVet Services

  • Sept – Up ↑ 0.28% (Last year Sept was Flat 0.00% – big difference)
  • Year To Date: Up ↑2.90%

Pet Food

  • Sept- Up ↑0.70%% (Last year Sept went Up ↑0.40% – welcome increase)
  • Year To Date: Down ↓-2.24%…Huge!

Pets & Pet Supplies

  • Sept- Up ↑0.55% (Last year Sept went Up ↑1.38%…Less Volatile)
  • Year To Date:↓-0.12%…coming back!

Total Pet

  • Sept- Up ↑ 0.44% (Last year Sept went Up ↑0.60% – All segments are up – more moderation)
  • Year To Date: Up ↑0.61% – On track for a moderate increase.

OBSERVATIONS

  • Food prices are still “in the cellar”. Let’s hope the September increase continues through December to moderate the impact of the deflation on annual revenues.
  • Supply prices are moving in the right direction and with an annual increase almost certain.
  • Veterinary and Non-Veterinary services are showing greater than normal increases for this time of the year. This is the opposite problem to food but can and will affect spending by price sensitive consumers.
  • The Total Pet Market Prices will definitely stay positive for the year. The YTD increase of 0.61% looks pretty nice until you look beneath the surface and see that it is produced by strong inflation in the Services and the steep deflation in the Food Segment. The annual projection will be in an acceptable range. We just need moderation in the segments.

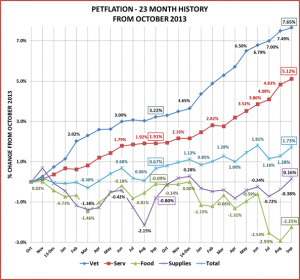
Next, let’s look at the monthly history over the last 23 months to put this month’s data into perspective. September of 2015 and 2014 are outlined so you can see the journey over the last 12 months.

CPI-9-15-2

COMMENTS

September is often a down month for Supplies but moderate for other segments. This year all segments turned up. This chart makes it easy to visualize our concerns. The Service Segments are basically going steeply up while the Supplies and Food Segment are on a roller coaster. Unfortunately, for Food the rollercoaster is “under water”. Total Pet is up about 1.1% versus a year ago.

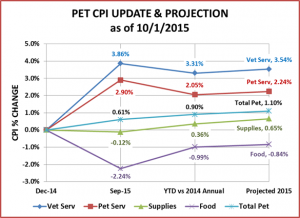
The chart below consolidates key data and compares the 2015 YTD CPI to the 2014 annual CPI. It also includes an updated projection of the annual CPI change for 2015. December could produce a drop in Food and/or Supplies but October & November are generally up…across the board.

CPI-9-15-3

COMMENTS – BY INDUSTRY SEGMENT

Pet Food – The price deflation in this largest segment is the biggest concern in the industry. Prices dropped -2.35% from June to August, the largest 2 month drop in history. They finally turned up in September and should continue upward through November. If we are lucky they will continue upward through December, like 2014. There is not enough time for a full recovery but this would help to mitigate the impact of what is certain to be the second consecutive deflationary year for this segment. Prices are now down -2.24% since December, but last month they were down 2.93%. Right now Pet Food prices are still basically equal to 2012 – three years ago. Remember, with a segment like Food, deflation doesn’t cause consumers to buy more. They buy the same amount…just spend less. We are projecting an annual decrease in the CPI of o.84%

Pets and Pet Supplies – In the chart prices are down 0.12% since December. However, December was the pricing peak for 2014 which was a first since the recession. When you look at the annual numbers, we are 0.36% ahead of last year’s overall pricing with at least two more months of highly probable increases. We may still see a price drop in December but we’re looking at a projected CPI increase of 0.65%

Since 2009, Supply prices have fallen 5.0%. Prices were flat in 2011(up 0.05%) but every other year showed a decline, with the biggest drop (down -2.1%) coming in 2013. It takes time and consistency to stop deflation. Let’s hope 2015 is the marks the beginning of the turnaround.

NonVet Services – Inflation in this segment is becoming an increasing concern. Instead of prices flattening out in the summer and early fall, the increases are accelerating. We now expect prices to increase 2.24% in 2015 but they could go higher. They are actually 2.9% above September 2014. This could slow the segment’s overall growth and limit the appeal to value driven consumers.

Veterinary Services – Prices in the Veterinary Services Segment are projected to be Up 3.54% in 2015. It looks like the segment will beat last year’s price increase of 3.5%. We saw in our recent post on 2014 Pet Expenditures that the segment continues to grow strongly but the increases are generally coming from the high income Pet Parents – $120K and above. Low income households spent $1B less.

Total Pet Market – We could be seeing the “beginning of the end” of the deflation that has plagued the Supplies segment since 2010. It’s a welcome change to have good pricing news for Supplies. The huge Food segment is the biggest ongoing concern. A second consecutive year of deflation is a certainty. Historically, food prices have only dropped in one other year – 2010 (-0.4%). We should note that this decrease came after an 8.6% increase in 2009, in the heart of the recession. It’s remarkable that the drop wasn’t greater. Deflation appears to be good for the consumer. It’s cheaper…I can buy more. That doesn’t work for products like food and it puts tremendous pressure on manufacturers and retailers. This can ultimately result in reduced choices for consumers…which is not good…and there is no easy fix. Make no mistake. You can charge more for your product. There is only 1 requirement. As we have often said, today’s consumers are searching for Value (quality + price). To charge more, you just have to be able to prove that the increased price is worth it…to an increasingly informed consumer…who can compare similar products and prices from a variety of retail channels while standing in the retail aisle. The Service Segments have the opposite problem… as prices continue to spiral upward. A high inflation rate may increase revenue as consumers pay more but it can and will eventually limit the appeal, resulting in a reduced market penetration and ultimately a reduction in the amount of services sold.

With all this “turmoil”, the projected inflation rate for Total Pet is a reasonable 1.1%!

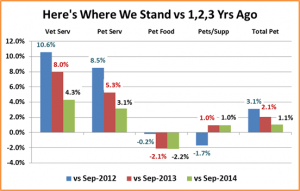
This last chart should help compare the recent up/down performance of each segment:

CPI-9-15-4

The turnaround for Supplies is apparent. You can also see the ongoing deflation problem in Food. Prices are even slightly below 3 years ago. The rising prices in the Service Segments are accelerating in 2015 and a big contrast to the Product Segments. I really like this chart as a visual reminder to look closer at what is producing the numbers in any analysis of data. The Total Pet numbers look very calm and controlled with an annual inflation rate of about 1%. However, when you look below the surface you see the turmoil in the segments that produced these “calm and controlled” overall numbers.


U.S. Pet Spending Up ↑$6.6B in 2014 – U.S. Government Survey

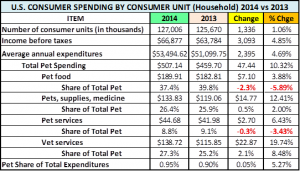
The latest Consumer Expenditure Survey conducted by the U.S. Bureau of Labor and Statistics was published in September. Pet Expenditures by the average Consumer Unit (Household) jumped from $459.70 in 2013 to $507.14 in 2014…a 10.3% increase…twice the rate of increase in total consumer expenditures, which was 4.7%.

Here’s what it looks like with details per industry segment:

CE-9-15-1

Let’s turn these “averages” into totals. It requires a special calculation because the data is gathered by 2 different methods but here’s what it looks like.

CE-9-15-2

Observations

  1. The number of Consumer Units also increased 1.06% to 127,006,000 so this means that the the total increase in Pet Spending was 11.4%
  2. While all segments are up, Supplies and especially Veterinary Services are the “drivers”!
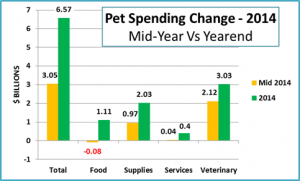
  3. Pet Services and Food are not as far up as the other two, but both are radically better than they were at the mid-year update published in May.
  4. In May Pet Food spending was Down -0.4%…Now Up 4.8%; Pet Services were Up only 0.9%…Now Up 7.6%
  5. The second half of 2014 was exceptional for the entire industry. Also, remember there was no price drop in December in Food and Supplies…which helped. Let’s hope 2015 is as good or better!

The Graph below should help you appreciate just how important the the second half of 2014 was for the Food and Supplies Segments and really the whole Industry…turning a good year into a great year!

CE-9-15-3

Right now I know there is still an unanswered question on everyone’s mind so let’s address it. “If the average U.S. household spends $507.14 annually on Pets, what do actual Pet Parents spend??”

If we assume that 65% of U.S. households have a pet(s), then their average annual expenditure on Pets, Pet Products and Services is $780.22.

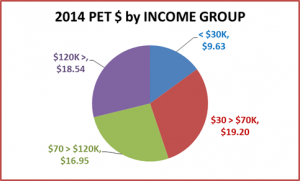
Next, there are a lot of consumer demographics that impact Pet Spending but the one we always seem to look at first is…income. We often look at over $70K vs under $70K because that has become the midpoint in total pet spending. That is changing. To give a better view, I have divided the Consumer Units (H/H’s) into 4 income groups. U.S. consumers spent $64.3B on their Pets in 2014. Here’s who spent it:

CE-9-15-4

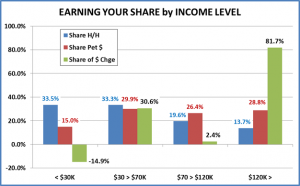
Let’s put this spending into perspective.

For each of the 4 income groups this chart shows their respective % share of:

  • Total U.S. Households
  • Total U.S. Pet Industry Purchases
  • The Total $6.6B increase from 2013 to 2014

CE-9-15-5

Observations

  1. A change in the number of H/H’s is also a factor. Overall U.S. gain is 1.3M households
    • Under $30K dropping down -0.6M
    • $30>$70K up 0.1M
    • $70K>$120K up 0.5M
    • $120K> up 1.3M…($150K> up 1.5M)
  2. The vast majority of the growth in Pet $ is coming from the wealthiest households. The H/H Pet Spending for $120K> is strongly increasing (+27%) and they are growing in numbers (+8%).
  3. It costs money to have a pet. The under $30K group is 1/3 of America but spends only 15% of total Pet $. This group is getting smaller as incomes rise but they are also “watching” their spending.
  4. Another 1/3 of America is the $30>$70K group. The $2B increase from this group is a bit of a surprise and merits a closer look. At this point the <$70K income group represents 67% of American households but spends only 44.8% of the Total Pet $. However, sales in the upper half ($30>$70K) of this group are growing… primarily by increasing H/H spending….not by a big increase in the number of H/H’s.
  5. $70>$120K – This includes much of the “Middle Class” that we hear so much about. It is also the first level in which the share of Pet $ exceeds the share of households. The big concern is that this 20% of America is showing almost no growth in Pet $. Here’s a tip. If you download the detailed spreadsheets that follow this post, you will see that the Pet Spending per household in this group is actually down 4%. The growth in this segment only comes from the fact that there are more households. This should be a major concern.(Note: the increase in H/H’s was at the upper end..the $100k>$120K range)

PET $ BY INDUSTRY SEGMENT AND INCOME LEVEL

2014 was a great year for the Pet Industry. However, we have seen that it was a little greater for some households, especially those with higher incomes. Let’s now take a brief look at the Individual Segments of the industry to see what effect the consumer’s household income level has on purchases.

For our review, we will divide the Industry into 2 groups – Products, which includes Pet Food and Supplies and Services, which includes Veterinary and A/O Pet Services. The specifics of the Total U.S. performance by Segment were included in charts on the first page. We will note the totals in a recap of each section below but the primary vehicle for comparison is the “share” chart that we used for the Total Industry.

PET PRODUCTS

Here are the “Share” Charts for Pet Food & Pet Supplies

CE-9-15-6

Observations

  • Pet Food 2014 – Total $24.1B; Up $1.1B (4.8%)…51% of the $ are done by under $70K H/H’s.
    • Pet Food made a tremendous comeback in the second half of the year. The “rolling” 12 months sales were actually down -$100M through June 2014.
    • The increase was driven by $120K AND the $30>$70K Group. The $120K> group had increases in spending and H/H’s. $30>$70K was due to increased H/H spending.
    • The Under $30K group had an increase in Food spending per household but was driven down by a decrease in the number of households.
    • The $70K to $120K had a significant increase in numbers but a big drop in household spending on Food. Since it is unlikely that there was a precipitous drop in the number of Pet Households, it is likely that this group began serious price shopping.
  • Pets & Supplies 2014 – Total $17B; Up $2.03B (13.6%)…44% of the $ are from under $70K H/H’s.
    • Up 6.5% at midyear, prices moved up…but sales still accelerated in the second half.
    • Many supplies are considered “discretionary” purchases. Even with price deflation during 2014, the growth was almost totally driven by income groups over $70K as most of America shopped for value or just said “no”.
    • The Under $30K group had a slight increase but 84% of total supplies are done by over 30K H/H’s.

PET SERVICES

Here are the “share” charts for Veterinary and Pet Services

CE-9-15-7

Observations

  • Veterinary 2014 – Total $17.6B; Up $3.03B (20.8%)…40% by under $70K H/H’s.
    • As you can see the over $120K H/H’s are the big driver as Veterinary Prices continue to increase at a high rate. Most other income groups appear to be choosing to defer, delay or seek other options in terms of traditional Veterinary Services.
    • H/H Veterinary Spending plummeted in both low income and the “middle class”…down $1.7B
    • The one surprise is the $30>70K group. There must be other factors beyond income.
  • Pet Services 2014 – Total $5.7B; Up $0.40B (7.6%)…Only 34% by under $70K H/H’s.
    • Once again the over $120K H/H’s are truly driving what is a below average increase in the industry. Inflation may be becoming an issue.
    • The $70K>$120K “middle class” is showing an increase. However, as with the Supply segment, the $30>$70K group is dialing back on spending on services…but still accounts for almost ¼ of the spending in this segment.

Overview by Income Group (See Data Download for details)

  • $30K or less – Pet Spending down -$0.98B. This is driven by a large (-653K) drop in the number of H/H’s and a slight drop in H/H Pet spending to $237.82. H/H spending ever so slightly up for Food, Supplies and Services. The big drop came in H/H Vet Spending -32%, which drove the Veterinary Segment down -$1B. This income group is obviously price sensitive and the ever inflating Veterinary Prices are having an impact.
  • $30K>$70K – Pet Spending up $2.02B. The increase in this segment is due to a 11.8% increase in H/H Pet spending to $447.78. There was also a 0.4% increase in the number of H/H’s (+147K). The increase in $ was not just across the board in every segment. They spent about -3% less per household on Supplies and Services which produced a drop of about -$0.13B. However, each H/H spent 8% more on food which generated a $0.6B increase. (The only other increase in Food spending came from the $120K> group.) The big dollars came from a 42% jump in H/H Veterinary spending producing $1.6B increase.
    • This $30>$70K group is obviously conscious of their spending as the two somewhat discretionary segments were essentially flat but the “necessities” of Food and timely Veterinary care were up…a lot. This is a significant change for this income group.
  • $70K>$120K – Pet Spending up $160M. This segment is growing in numbers (+482K) but Pet H/H spending is down -4% to $651.85. Like the $30k>$70K segment, results are mixed…but exactly opposite. There is increased H/H spending on Supplies and Services while spending on Food and Veterinary are down. The biggest changes are in Veterinary, down -$0.64B and Supplies, up $0.87. The changes in the other segments are slight. Food is down -$0.13B and Services are up only $0.06B.
    • With income above the National average of $67K, this group has always been a prime focus for our industry so the relative lack of performance is a concern. When you look at the income ranges within this group, you see that the drops in spending in Veterinary and Food occur across all income values. We have noted that most Americans have become more value conscious. It appears that a certain percentage of this group started “shopping around” or delayed some services.
  • $120K> – Pet Spending up $5.37B. What can you say? This is the fastest growing segment in number of households (+1.332K). The total H/H increase for the country was (+1,336K) so the net increase for all groups below $120K was (+4). Combine that with a 27% increase in Pet H/H spending to $1067.08 and you get a fairy tale. All segments are up. Veterinary and Supplies have the biggest increases with $3.1B and $1.2B respectively. Although Food at +$0.71B and Services at +$0.35B are also the biggest increases for any income group. Currently, this is the biggest opportunity in the industry. They shop at a variety of retail channels…Pet Specialty, Clubs, even Value Stores but also remember… that 94.5% of them have high speed internet service!

A Final Note

Up $6.6B! The “Headline” news for the industry is spectacularly good. However, as usual when you start looking at the details you find pluses and minuses. That’s not bad. Even the negatives are usually opportunities that, if properly handled, can generate unanticipated growth.

The Demographics of Pet Spending gives different ways to look at the market…. We looked at income. How about age, H/H composition, occupation, race/ethnic background, education, home tenure…? The USBLS has provided Pet Spending for these demographics and more. Here are a few interesting demographic “headlines” about Pet spending in the U.S. that we may address in future posts:

  • Married Couples up $8.2B; Singles down -$1.6B
  • African Americans up $1B; Hispanics down -$1B
  • Own your home up $3.5B; Renters up $2.7B (27%)
  • Over age 65 up $3.1B…”Retired” up $1.9B

Let’s take another look at that last headline. It may have given us a clue to the somewhat unusual spending patterns in the $30K>$70K group…“Baby Boomers” are generally given a lot of credit for the fabulous growth of the Pet Industry…but we/they are getting old. What is happening…what will happen? Let’s look closer…

  • Age 65+: H/H’s up 1,165K; Income $45K; Pet Spending Up $3.1B; Spend 1.02% on Pets
  • Retirees: H/H’s up 653K; Income $39K; Pet up $1.9B; Spend 1.0% on Pets; Also spend 21% of Total Service $

Well, that seems to make the performance of the $30K>$70K group a little clearer, but what action should be taken? Aging causes changes. Money becomes a concern and formerly easy tasks become harder…but you don’t want to give up the things that make life worthwhile…like your pets. Retailers and service providers could offer a Senior Discount…say 10% off for age 65 and older. This should be affordable and definitely make it easier for Senior Pet Parents, a fast growing demographic, to continue the benefits of having Pets.

One last bit of info….The 25>34 age group has an average income of $61K and their Pet Spending is up $1.5B!  It turns out that the Pet spending in the $30K>$70K is being driven by both ends of the Age Spectrum. It reinforces that Pets are a lifetime commitment and bodes well for the industry!

As promised, a 2 page detailed Appendix on Pet Spending by Income Group is available through the link below. Just click on the button to download and save the file as a PDF. If you would like this in Excel format, send me an e-mail request.

[button link=”https://pmud8a.a2cdn1.secureserver.net/wp-content/uploads/2015/10/PetSpendByIncomeGroup2014.pdf” type=”icon” newwindow=”yes”] Download Data (PDF)[/button]