Petflation November Update – Have prices peaked for the year?

The CPI data for November is out – a pretty “normal” month overall – for a change. The total pet market prices didn’t change much +0.17%. Every segment was up. Pet Supplies prices were up but the increase was less than half that of 2013. The Pet Food CPI was up – just barely. Service prices were both up about 0.2%. This is about twice the normal November increase. So we stand at what is the “normal” pricing peak for the year. In recent years December has brought precipitous drops in Food and Supplies prices, driving the Total Pet Market pricing down.

Key 2014 November Facts:

  • All segments showed price increases
  • Supplies and Food were up slightly less than “normal” for November
  • Vet and Pet Services were up more than a usual November
  • Overall result…Total annual projection still basically unchanged from last month

Here are the specifics:

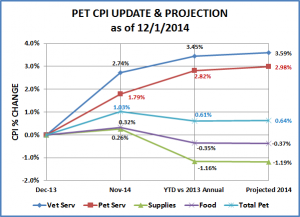
    • Vet Service CPI – Up 0.18% over October – Higher than normal.
      • Up 2.74% since Dec.
      • Projected – Up 3.59% for year. (last  month’s projection was 3.63%)
    • Pet Services – Up -0.21% over October – Higher than normal.
      • Up 1.79% since Dec
      • Projected – up 2.98% for the year (last month’s projection was 3.08%)
    • Pet Supplies – Up 0.31% over October– About ½ usual   jump for November.
      • Down -0.26% since Dec.
      • Projected – down -1.19% for the year (last month’s projection was -1.26%)
    • Pet Food – Up  0.03% from October – Essentially flat.
      • Up 0.32% since December
      • Projected – down -0.37% for the year (note: last month projection was -0.39%)
    • Total Pet – Up -0.17% from October – All segments up.
      • Up 1.03% since Dec
      • Projection – up 0.64% for the year (last month’s projection was .62%)

Here’s what it looks like along with updated annual projections:

NovCPI-Update

The Total Pet 2014 CPI projection is inching upward. It’s now at +0.64% versus + 0.62% last month and +0.60% two months ago. This is primarily being “fueled” by increases in the Supplies Segment. The Service segments have slowed their rate of increase and Food Prices have become essentially flat.

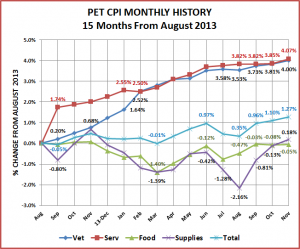
Here’s what the last 15 months of CPI’s look like.

CPI-Monthly-Nov-2014

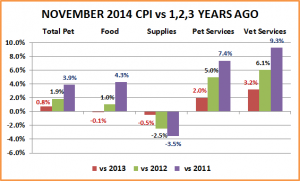
Here’s how we stand in pricing in November 2014 versus a year ago or 2 or 3:

NovHistorical

 OBSERVATIONS AND EXPECTATIONS

Pet Services – Prices are 2% higher than they were 1 year ago. The increases have slowed in recent months. Expect December prices to go up about 0.2% to produce an increase in the annual CPI of 3.0%

Vet Services – Prices are 3.2% higher than they were a year ago. The usual Fall price increases have been lower than normal. In recent years, the December CPI change has been inconsistent in this segment, ranging from No Change to +0.6%. Expect an increase of about 0.3% in December and an annual CPI increasea of 3.6%. Much of this was driven by strong increases in the first half of 2014.

Services Total – There will still be a 3+% increase in prices for the year but it was almost all generated in the first half of the year as price increases have slowed markedly since June. As was stated in an earlier Post, without the increases in Vet & Non-vet Services, Total Pet Prices would be down for the year!

Pet Food – Pet Food prices are -0.1% lower than they were a year ago. They are also only 1.0% higher than they were 2 years ago. That means that the prices in this largest Pet Segment have been essentially flat or down for 2 consecutive years. The Food and Treats segment has become increasingly price competitive as the Consumers have become more “value conscious” in their shopping habits. Expect prices to drop -0.4% in December and the overall CPI to fall -0.4% for the year.

Pet Supplies – Prices went up 0.31% in November, which is just slightly less than ½ of last year’s increase (+0.7%). Three consecutive months of strong increases have brought Supply prices back somewhat, -0.5% below where they were 1 year ago. They are still -3.5% below the prices in November of 2011. Expect prices to drop -0.7% in December, resulting in a CPI drop of -1.19% for  the year.

Pet Food & Supplies – These segments are about -0.5% below where they were in November 2013 and -0.3% below 2012. Taken together the prices in these Product segments  have basically been flat to just “below the surface” for about 2 years. Expect a drop of -0.6% in December and -0.9% for the year.

Total Pet – Prices are 0.8% higher than they were 1 year ago. This is driven totally by the Service Segments as Pet Products prices are down. We should see an overall increase of 0.64% in the Total Pet CPI for 2014. This would be second only to 2010 which had a 0.62% price increase over 2009. It will be close. In fact if Service Price increases are less than expected and Product Prices have a deeper drop…we could see a new low.

Question for December – Will the price drop in December be even greater than expected? We noted in a recent post that overall the November Retail Lift for 2014 was about the same or a little less than 2013. In fact, sales in the Miscellaneous Store Channel (includes Pet & Gift Stores) were actually less than 2013 – no lift, a drop. Will the pressure to make yearend numbers result in even deeper and more widespread discounts than usual? We’ll see.

Prices are prices…Why the concern about inflation or deflation?

Because extremes of either, especially over an extended period of time, can severely affect a segment or even the whole market.

Let’s look at an inflation example – Veterinary Services. For 16 years the annual inflation rate averaged 5.0%. The segment continued to show growth beyond just price increases…until 2011, when for the first time consumers actually bought less in terms of the amount of Veterinary Services. In 2012 they bought even less and the amount of Veterinary Services in 2013 was effectively the same as it was in 2010. What’s next for this segment remains to be seen. Pet Insurance, consolidation of clinics, an increased number of OTC medications, home testing…all could be possibilities…if they help to mitigate the cost of Veterinary visits. The consumer has become more value driven since the “great recession” and price increases must be reasonable…or they find an alternative or buy less. This behavior is most noticeable in discretionary spending but it also affects “essentials” like food and veterinary services.

Deflation is most common when a product group becomes commoditized and there is an abundance of supply. With no demonstrable difference in quality, price becomes the overriding factor to the consumer. Let’s look at a nonpet market that affects us all – oil. OPEC producers have decided to keep oil supplies extraordinarily high. This has produced a precipitous drop in gasoline prices…great news, right? Initially, yes. However, there may be some costs to the consumer in this strategy. OPEC countries produce oil cheaply and have a greater profit margin than some of the alternative production methods being employed elsewhere. These producers have a lower margin. They must be competitive so a substantial drop in retail prices results in either NO sales or turns low margins into NO margins…they can’t afford to run their businesses…so they will start to close them. This will ultimately cost thousands of jobs but gasoline prices are still low, right? That’s right. However, when a substantial number of “alternative” competitors have gone out of business, the OPEC members could decide to start scaling back production. As supplies fall, the prices start back up. To what level? With less competition, the OPEC members now have greater control…so it’s up to them. They can sacrifice margin for a period of time to reduce competition. As prices rise, some of the “alternative” competitors will come back…but fewer than before. Of course, the OPEC members can start the whole process over again.

As we have noted in an earlier post, deflation in the Human Toys market began in 1997 and prices have fallen ever since. The result: There are far fewer manufacturers competing in this category. We have only 1 major Retail Toy store chain left and they are on shaky ground. The retail sales in this market have migrated to general merchandise stores and the internet. In fact 30% of all toy sales are done by 1 National General Merchandise Store chain.

We are seeing indications of consistent deflation in the Pet Supplies segment and some initial signs in the Food Segment. Driven by the commoditization of more and more categories, overall Supply prices have been generally falling since 2009. This reduces margin which makes competing more difficult so companies start to “opt out”. There is less money to fund innovation and it becomes increasingly difficult for start ups. At retail, consumers start migrating… looking for value.

What’s in store for Pet? That’s up to us.

I know that you’re tired of hearing this…but since the great recession the consumer has demonstrated every day that they are driven by:

  1. Value
  2. Convenience
  3. Selection
  • Run your business more efficiently. Keep price increases to a minimum. Consumers expect prices to go up over time, but reasonably. What is reasonable?…only the consumers decide and they don’t tell us in advance. For the overall Pet Market it looks like a CPI increase in the 1-2% range is reasonable.
  • Need more $? Innovate! People will pay more for a demonstrably better product.
  • There is a lot of emotion in Pet Ownership. Consumers will also pay more for products with an “emotional” value. Some licensed products fit this description.
  • Convenience – Business and life in today’s world are both tough. Look for ways to make being a pet parent easier. “If you find it, they will come.”
  • Selection – Manufacturers and retailers should understand the consumer buying decision tree in each category and make sure they offer choices at the key decision waypoints. Retailers – Face it. You can’t build a store as big as the internet. You can offer online ordering with a larger selection…and when it makes sense, give them an in store pick up option…with a discount for their in store purchases.

Get a fast start in 2015 and make it your best year ever!

It’s the Holiday Season – How’s the lift going?

Recently we took a look at the history of the Holiday Lift. As you recall, overall the peak has dropped considerably since 1992. At that time the peak of the lift was over 40%. In 2012, it was down to +23% – a  decrease of over 40%.

Remarkably, the lift for November has remained relatively constant through the years at about +7% – despite the increased hype over Black Friday and even with the kickoff time being pushed up to Thanksgiving day and earlier.

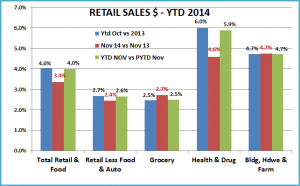
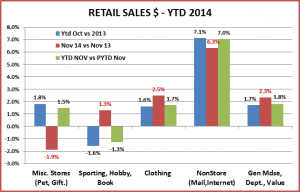
The Census Bureau just released the Advanced Retail Sales for November. Let’s take a look and see how we’re doing this year in retail sales compared to 2013. To make it easier to view the results from different channels, we’ll break the data into 2 charts and compare:

  • Year to date Retail $ales through October (before the start of the holiday lift)
  • November 14 $ vs November 13 $
  • Year to date Retail $ales including November vs the same period in 2013

RtlSales1

OBSERVATIONS

  1. The Retail less Auto and Restaurants is the most relative overall view for the Pet Industry. Note that November was up 2.4% over last year. However, since October YTD was up 2.7% November sales actually lowered the YTD increase.
  2. Grocery had a good month but not enough to make a difference in YTD overall.
  3. November is traditionally not a good month for Drug. This year, November didn’t match the YTD rate of increase.
  4. Building, Hardware and Farm stores – Fall/winter is not their season but they are holding their own.

RtlSales2

OBSERVATIONS

  1. The General Merchandise Stores, including Department Stores, Discount Stores, Clubs, SuperCenters and Value stores expect and need a strong Holiday Season. November sales were up 2.3% – not much but it is better than the YTD rate so it helps.
  2. The Internet/Mailorder Channel was up 6.3% in November, slightly below their October YTD rate so November was a slight drag overall.
  3. Clothing and Accessory Stores had a good November. This channel depends on a strong Holiday Season.
  4. Sporting Goods, Hobby and Book Stores – November sales were up…finally. It will be very difficult for this Channel to break even for the year.
  5. Miscellaneous Stores includes outlets like Florists, Gift and Pet Stores (Pet is about 20% of the total outlets). November was not good…as sales were down -1.9%. December is the most critical month in this channel.

We have looked at November’s sales. Overall it was an OK month, give it a “C” or “C-“. How does this affect the anticipated Holiday Lift which starts in November? The next 2 charts will compare this year’s November “lift” to the ones in 2012 and 2013.

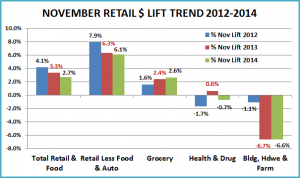
Here is the first group, including the overall National numbers:

NovLift1

OBSERVATIONS

  1. Overall the lift in November is definitely trending down. However, there is a factor that is “unseen” in the data. We have noted that VALUE is increasingly becoming the key driver in consumer purchasing behavior. Thanksgiving is the kickoff time to the holiday “deal” season. Consumers often delay purchases until then. In 2014 Thanksgiving was on 11/27. In 2013 it was on 11/28. However, in 2012 Thanksgiving was on 11/22 – 5 or 6 days earlier. This meant that in 2012 the November portion of the holiday season had almost a week more of intense shopping so it is not surprising that the lift was higher.
  2. Retail Less Restaurants and Auto – Had almost an 8% lift in 2012. The extra 5-6 days of shopping probably pushed November up close to an additional 1%. However, even allowing for this “bump” in 2012, the subsequent years are still trending downward.
  3. Grocery is not traditionally a channel with a big holiday lift. However, you can see that this big segment is steadily improving.
  4. The lift in Drug usually occurs in December. November is often flat to down.
  5. The late fall and winter months are not a “lift” time for Building, Hardware and Farm stores. The drop in 2014 was similar to the pattern in 2013.

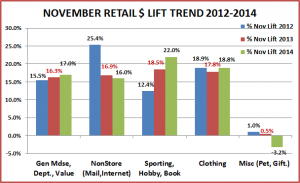
In the next chart we will take a look at Miscellaneous Stores which includes Pet and Gift outlets along with some channels that are impacted early and strongly by the Holiday lift.

NovLift2


OBSERVATIONS

  1. General Merchandise stores are big drivers in the Holiday Sales Season. They are big promoters and try to push the kickoff time up a little bit. The lift has increased slightly in November each year since 2012.
  2. The Internet/Mailorder has had the greatest overall holiday lift. In this chart you can see that, while still substantial, the November portion is trending down. Part of this is due to the fact that this segment has substantially increased everyday sales so the Holiday lift is less pronounced.
  3. Sporting Goods, Hobby and Book Stores – A substantial increase every year since 2012.
  4. The November lift has remained relatively strong and steady for Clothing stores.
  5. Miscellaneous Stores (includes Pet and Gift) didn’t have a good November. The bulk of the lift in this segment comes in December but in 2014 they’re starting out “in a hole”.

In November the Retail Sales for all channels less Restaurants and Auto was $314B – up $7B (2.4%) from 2013. It will be the third biggest month of 2014 – behind only May and of course December. By the way, a reasonable estimate of December sales this year is $365B vs last year’s $356.5.

Regarding the November portion of the lift, it seems to be trending down slightly. Moving up the kickoff of Holiday shopping may help…at least when it is done by the calendar…and especially when November 1 is on a Thursday, which can give us up to 6 more “official” holiday shopping days in the month.

By the way, in the midst of the Great Depression, President Roosevelt tried to move Thanksgiving to the third Thursday of the month (from the last Thursday) in the years 1939-1941. Some people say he was urged to do this by Retail executives in order to extend the Holiday shopping season. The effort ultimately failed and Thanksgiving was set as the fourth Thursday of the month by an act of Congress which was signed by the President on December 26, 1941…less than 3 weeks after we entered World War II.

So I guess we could write our Congressmen….or better yet…..Enjoy the Holiday Season and have a great New Year!

Petflation October Update – Truly Mixed Signals!

The CPI data for October is out – with truly “mixed signals” – up, down and sideways. The total pet market prices didn’t change much +0.14% over September. Pet Supplies were up, but the increase was slightly lower than 2013. However, the Pet Food CPI dropped, which is unusual for October. Service prices were both almost “flat” – up less than 0.1%, very low for the Fall. Since the October Total Pet CPI surpassed June prices, the previous high point, we’re back on track for November to once again be the priciest month for the consumer to buy pet supplies and services.

Key 2014 October Facts:

  • Another large price increase in the Pet Supplies Segment – up 2.1% in 2 months. Huge.
  • Prices continue almost flat in Service segments.
  • Food prices drop slightly…. the norm is an October increase
  • Overall result…Total annual projection basically unchanged from last month

Here are the specifics:

    • Vet Service CPI – up 0.08% over September – Increases “flattening” out.
      • Up 2.55% since Dec.
      • Projected – Up 3.63% for year. (last  month’s projection was 3.66%)
    • Pet Services – up 0.03% over September – Continuing essentially flat. Unusual.
      • Up 1.57% since Dec
      • Projected – up 3.08% for the year (last month’s projection was 3.21%)
    • Pet Supplies – Up 0.69% over September– Normal jump for October.
      • Down -0.055% since Dec.
      • Projected – down -1.26% for the year (last month’s projection was -1.39%)
    • Pet Food – down  0.05% from September – Small change but Oct drop is not normal
      • Up 0.29% since December
      • Projected – down -0.39% for the year (note: last month projection was -0.42%)
    • Total Pet – Up -0.14% from September – Back on track…barely.
      • Up 0.86% since Dec
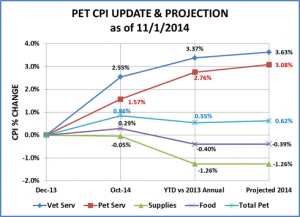
      • Projection – up 0.62% for the year (last month’s projection was .60%)

Here’s what it looks like along with updated annual projections:

Oct14CPISummary

Once again there is little change from last month’s overall  Total Pet projection…up 0.62% for the year versus up 0.60% for the year. However, Food prices dropped, which is very unusual for October. Service prices were almost flat. In fact the only normally performing segment was Supplies which had a reasonable increase. It has been a while since we have described Supplies as performing “normally”.

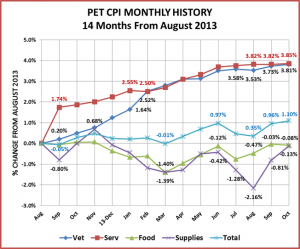
I think the monthly pattern helps us all to get a better understanding of what is happening in the market and what may occur during the balance of the year. I added the October numbers to the graph that I produced last month.

Here’s what the last 14 months of CPI’s look like.

Oct14MonthlyCPI Hopefully, the graph makes it easier for you to see both the similarities and the differences between segments and how they blend together to produce the overall industry total.

For the balance of 2014

Pet Services – The biggest price increases in this segment tend to come in Spring and Summer and slow down in the Fall and Winter months.This segment is performing according to the expected pattern. However, the Fall increases are considerably lower than normal. We can expect slight price increases in November and December.

Vet Services – This segment is not performing according to the expected pattern. The biggest price increases come in the Fall and Winter months. While prices have moved up since August, the change has not been of the usual order of magnitude. We can still expect increases in November and December. The only question is, “How big will they be?”

Services Total – Overall the prices have been basically flat since June. There will still be a 3+% increase in prices for the year but it was almost all generated in the first half of the year. These segments have had almost an identical pricing performance “footprint” since February of 2014. Without the increases in Vet & Non-vet Services, Total Pet Prices would be down for the year!

Pet Food – As you know, Food is the largest segment and is the biggest “driver” for the Total Pet Market. Food and Treats have become even more intensely competitive, driving prices down and resulting in somewhat erratic behavior in terms of pricing. The pricing in this segment still has a roller coaster pattern but it has been all downhill as prices this year have consistently remained below 2013. Also in recent years prices rise through November, then drop sharply in December. August and September had “normal” increases but October produced a rare price drop. We should expect some sort of increase in November followed by a December drop. The question is how big of a drop? It does seem to be a pretty good bet that overall Food prices will be down for the year – for only the second time in history.

Pet Supplies – Prices went up 0.69% which is just slightly less than  last year (+0.8%). However, with last month’s 1.38% increase, it means that prices are up 2.1% over 2 months. The last time that happened was Jan-Mar 2009. As you recall, Supply prices hit their all time peak in 2009 and have been deflating ever since.

With the October increase, prices are only 0.1% below what they were in October of 2013…and equal to June of 2008. What about November and December? Prices should continue up in November but how much? This has been a steep rise in prices. Let’s put it in perspective. If we have a 0.0% increase in November, this 3 month price increase “run” would still be the 6th largest in history. While we are unlikely to overtake the #1 spot , a 3.2% increase from June to September of 2007 (before the recession), it still is concerning. And how steep will December’s drop be? The recent increase has certainly mitigated the deflation in supplies…now expected to be less than 1.3% for the year. However, it has also reinforced the “volatility” of this segment.

Pet Food & Supplies – These segments are only about 0.1% below where they were in October 2013. However, they have basically been “below the surface” in the interim months. Both should rise in November and drop in December. The question is how much?

Total Pet – As we said earlier, without the price increases in the service segments, prices in the Total Pet market would be down for the first time ever. As it is, we are on track to compete for the lowest increase of all time – 0.6% in 2010. This may be a very real possibility. If Service prices continue their current pattern of minimal increases and Food and Supplies prices have their normal December price drop, then 2014 could beat 2010.

The pricing in the Total Pet Market is being driven consistently up by the Services but gets its rollercoaster pattern from Food & Supplies. While service price increases have been happening for a long time, this rollercoaster pattern in Food & Supplies just started in 2009. In the years prior to 2008 these segments were less erratic and prices grew at a relatively slow and steady rate. Prices on Food actually went up in December in all but 1 year (1998) prior to 2009. In 2008 prices started sharply upward. The biggest price increases in history occurred in 2008 & 2009 – during the teeth of the recession. Then in September of 2009 the bottom dropped out of food and supply prices and we have been on a rollercoaster ride ever since.

It would be nice to get back to “normal” but all the major business publications say that the recession changed the U.S. consumer forever…with value (price+quality) becoming the overwhelming factor in purchase decisions. It seems that this new “normal” is contributing to the erratic CPI in the segments in our industry.