Petflation September Update – Supplies Pricing Up…Way Up!
The CPI data for September is out. The big news again is from…Supplies – Prices Up, Way Up! This is the first September increase for Supplies prices in 5 years and at 1.38% – the 6th largest monthly increase in history. In recent years, driven by drops in Supply Prices, September had become the month for lowest overall pet prices…not in 2014.
Key 2014 September Facts:
- Huge price increase in the Pet Supplies Segment.
- Prices almost flat in Service segments.
- Food continues “normal” Fall increase.
- Overall result…Total annual projection basically unchanged from last month
Here are the specifics:
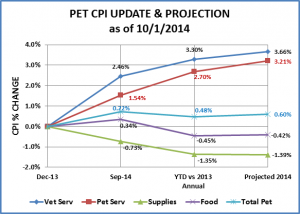
- Vet Service CPI – up 0.19% over August – As expected – a little lower than anticipated
- Up 2.5% since Dec.
- Projected – Up 3.66% for year. (last month’s projection was 3.68%)
- Pet Services – down -0.03% from August – Essentially flat. Unusual.
- Up 1.5% since Dec
- Projected – up 3.21% for the year (last month’s projection was 3.36%)
- Pet Supplies – Up 1.38% over August – First September increase in 5 yrs…and a big one.
- Down -0.7% since Dec.
- Projected – down -1.39% for the year (last month’s projection was -1.56%)
- Pet Food – up 0.44% from August – Normal Fall increase continues
- Up 0.3% since December – Finally got back to where we started the year.
- Projected – down -0.42% for the year (note: last month projection was -0.47%)
- Total Pet – Up 0.6% from Aug – Back on track
- Up 0.7% since Dec
- Projection – up 0.60% for the year (last month’s projection was .55%)
Here’s what it looks like along with updated annual projections:
Ultimately there is little change from last month’s overall Total Pet projection…up 0.6% for the year versus up 0.55% for the year. However, the way that it was produced was interesting. Service Prices (Vet and Non-Vet) have slowed their inevitable climb while Pet Supplies started back up…in spectacular fashion
I think the best way to appreciate what is happening and to discuss what is possibly in store for the balance of 2014 is to look at the pattern by month.
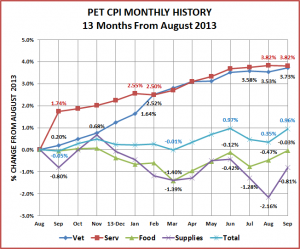
Here’s what the last 13 months of CPI’s look like.
This graph is definitely more interesting and makes it easier to “see” how the action in the 4 individual segments produce the overall industry total. There is a mix of slow steady climbs and…roller coasters.
For the balance of 2014
Pet Services – Basically climbed steadily for the first half of the year, then flattened out. Expect prices to climb to a peak in December. The prices in this segment have grown unchecked for 16 years at a 3.4% average annual rate of increase. They need to slow down or they will inevitably face a correction in the amount of services consumers buy. This “correction” has occurred in every other pet segment.
Vet Services – As you recall from a previous post, since 1997 Veterinary Prices have risen at a rate that is 46% faster than Human Medical Care. For the past 4 years the amount of Veterinary Services purchased by consumers has been effectively flat. Price increases have slowed since April and been minimal since June. The August “dip” this year was normal. Last year the “dip” was followed by 5 months of rapidly rising prices. Expect prices to continue up for the balance of the year – peaking in December.
Services Total – Since February 2014, these two segments have been performing in “lockstep”. You almost only need 1 line on the graph.
Pet Food – This largest segment of the market has been performing in “untypical” fashion. In a “normal” year Food prices climb from August through November and then drop sharply for 1 month in December. They start back up again in January. Last year, Food prices were essentially flat from August through November. They dropped in December then kept on dropping to the low point in March. The second quarter brought increases followed by a “normal” July drop. So far, August and September look pretty normal. Expect prices to rise through November with a fairly substantial drop in December. Note: the CPI for Pet Food in September of 2014 is almost exactly the same as it was in September of 2013. Expect overall prices to be down for the year – the second time in history.
Food Clarification: Although the segment is called Food. The USBLS includes treats in this survey. Basically, if it has calories, it’s a food. The consumer has a wide variety of pet foods to choose from, especially for dogs and cats. There are actually even more companies that provide treats. At SuperZoo and GPE, there were over 240 exhibitors (1 in 4) offering dog and/or cat treats. This enhanced competitive environment could be a factor in pricing pressure.
Pet Supplies – Although it came in an unexpected month, Supply prices finally went up…big time… +1.38%. Monthly price changes of over 1%, up or down, have occurred on average less than once a year. The last time that Supply prices rose in September was 2009. Prices then uncharacteristically dropped in October and November. In fact, October 2009 marked the starting point of the current 5 year deflation. Let’s hope that history doesn’t repeat itself.
Coincidently, the big increase in the CPI also put this segment at exactly the same level as it was one year ago – in September 2013. Although, we have a different perspective, as September was the pricing low point for last year. We also should note that prices are currently at the same level as they were in March 2008 – over 6 years ago. Expect prices to continue up in October and November, then drop sharply in December. Net drop for the year should be less than 1.5%.
Pet Food & Supplies – Both of these segments usually have an annual rollercoaster ride. Although, the peaks, valleys and monthly changes on the Supplies ride tend to be more extreme. Let’s note again that both segments are almost exactly where they were one year ago. Combined, the difference is less than 0.02%. Look for 1 more dip in this year’s ride – December.
Total Pet – The monthly performance of the Total Segment is also a roller coaster because of the influence of Food & Supplies. Services are pretty consistently up so they just tend to keep the prices in the market higher. The Food segment is the largest, so the overall market tends to mirror it’s pattern – except when there is a big disparity in performance. Look at August 2014. Services – Flat; Slight increase in Food; Big drop in Supplies. Result: Total Pet down slightly.
Expect prices to rise in October and November, then drop slightly in December. The amount of the December dip will depend on how much Food and Supplies fall. For the year, prices should be up about 0.6%, matching the lowest annual increase ever – which occurred in 2010.
Note: An updated printable version of all relevant 2014 posts is available. It has a table of contents for easy reference and is segregated by chapters to facilitate printing of specific sections. To receive an electronic copy (including this post) by e-mail, contact me at gpsforpetbusinesses@gmail.com


